.svg)

Aug-2026
Sales
Trend
6-Month
Product Count
SKUs
Avg Price
YoY Sales Change
YoY Price Change


Where to Buy
Tasteology is stocked at 90 licensed dispensaries across Pennsylvania, Ohio, and 3 other states, 34 of them in Pennsylvania, with the deepest coverage in Pittsburgh, Lancaster, Philadelphia, Aliquippa, and Altoona. Search by ZIP code or city below to find the closest one, or filter by product type if you are after a specific format.
Market Insights Snapshot
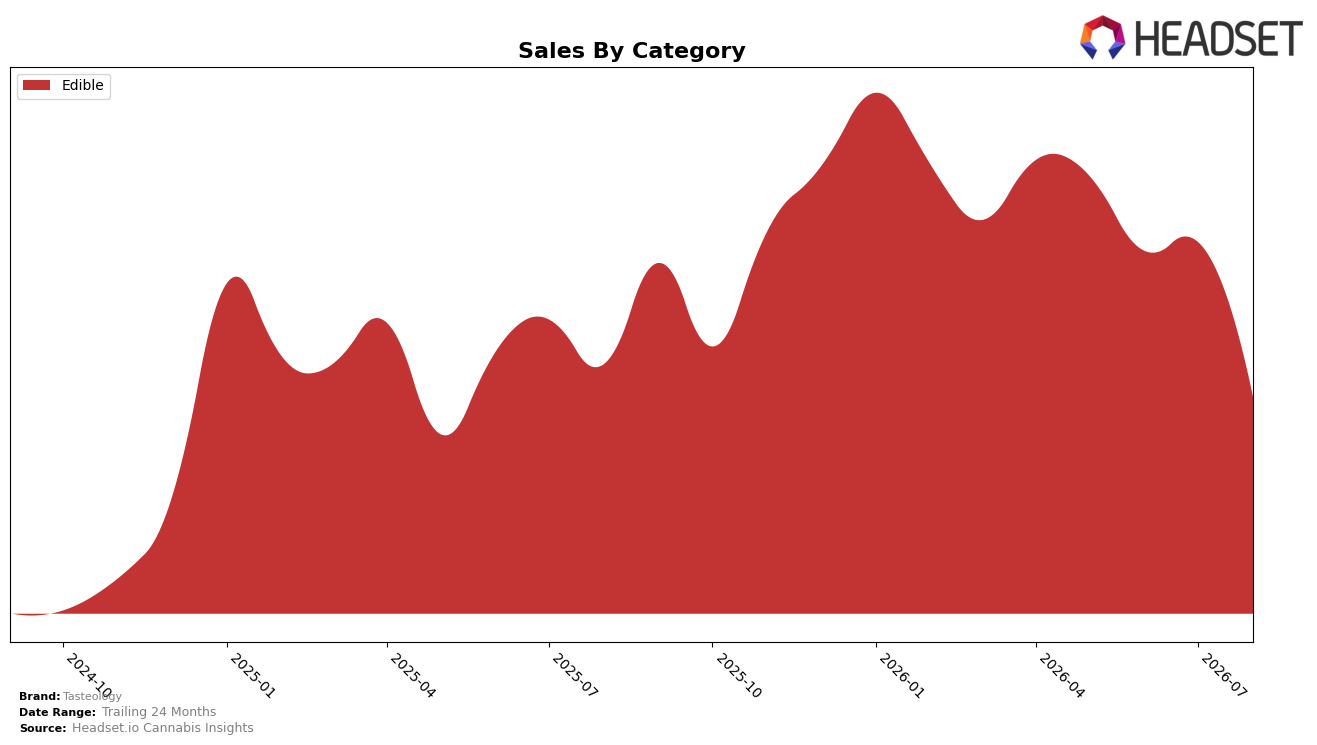
Tasteology operated as a single-category brand in August 2026, with Edible accounting for 100.0% of sales and ranking 50th within Edible in Ohio. Year over year, Edible sales declined 10.7% while the average price fell 14.1%, and month over month sales fell 35.9% alongside a category share that remained at 100.0%. The pattern implies price compression outpaced demand contraction, and the steep August 2026 month-over-month drop suggests a seasonal or promotional pull-forward that left volume light despite unchanged category concentration.
With all volume in Edible and a 50th rank in Ohio, the 35.9% month-over-month retreat paired with a 10.7% year-over-year decline signals a positioning skewed toward lower-priced Edibles that are not converting to sustained share gains. The 14.1% price decrease without diversification beyond Edible implies a discount-reliant stance that erodes value density; to recover rank, Tasteology must either reprice toward margin while stabilizing velocity or add adjacent formats to buffer August 2026 volatility.
Competitive Landscape
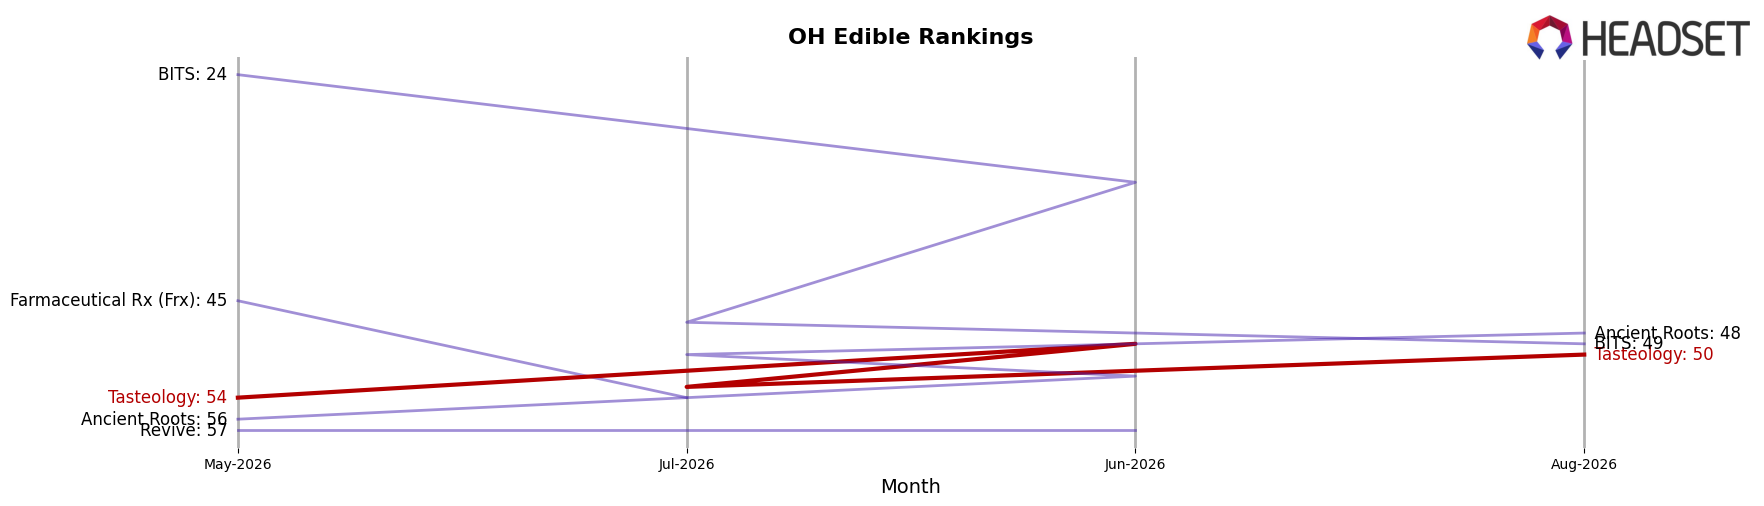
Tasteology sits at rank #50 in OH Edible for August 2026, improving 13 positions from #63 year over year, yet slipping 6 spots from #44 at its January 2025 peak and falling -4 ranks from #54 in May 2026 to #50 in August 2026. Meanwhile, Gron / Grön climbed from #8 to #1 with 91.3% YoY sales growth, and Incredibles held near the top, edging from #1 to #2 with 3.4% YoY growth; against this top-heavy consolidation, Tasteology’s YoY rank gain (+13) alongside a 3-month slide from #54 to #50 implies a mid-pack rebound that still trails the pace-setters and requires sustained month-over-month gains to avoid being boxed out by faster risers.
Notable Products
Sativa Blood Orange Boost Gummies 10-Pack (100mg) delivered the standout move in August 2026 with a 69% month-over-month rise to rank 1, while Sour Strawberry Lemonade Fast Acting Chews 20-Pack (100mg) fell 56% to rank 3. Blueberry Calm Chews 20-Pack (100mg) declined 59% at rank 8, and CBD/THC 1:1 Passion Raspberry Gummies 10-Pack (100mg CBD, 100mg THC) dropped 41% at rank 7, indicating sharp dispersion in performance within the top tier. All top-10 items are Edibles, and four of the top ten are 1:1 CBD/THC SKUs concentrated between ranks 4 and 7, yet that cohort shows double-digit month-over-month contractions ranging from 24% to 59%. The pattern implies Tasteology is pivoting toward single-compound, mood-forward gummies where one breakout leader can offset weakness in balanced 1:1 formats.
Top Selling Cannabis Brands






Data for this report comes from real-time sales reporting by participating cannabis retailers via their point-of-sale systems, which are linked up with Headset’s business intelligence software. Headset’s data is very reliable, as it comes digitally direct from our partner retailers. However, the potential does exist for misreporting in the instance of duplicates, incorrectly classified products, inaccurate entry of products into point-of-sale systems, or even simple human error at the point of purchase. Thus, there is a slight margin of error to consider. Brands listed on this page are ranked in the top twenty within the market and product category by total retail sales volume.

