.svg)


Market Insights Snapshot
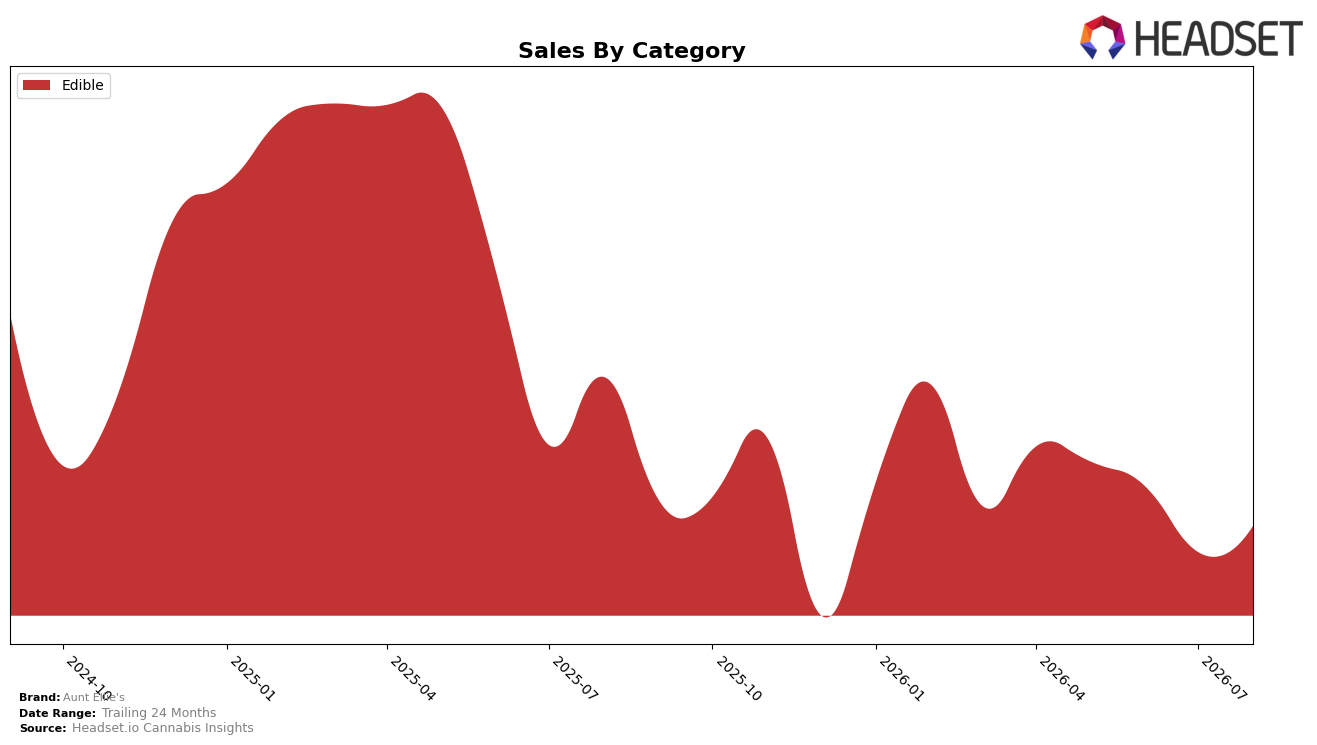
In August 2026, Aunt Ellie's operated as a single-category brand with Edible accounting for 100.0% of sales, posting a 5.99% month-over-month rise alongside a 24.31% year-over-year decline. Average price rose 2.16% YoY to $10.93, while overall brand sales fell 24.31% YoY, indicating mix stability but volume compression within the sole category. Ranked 36 in Edible within Arizona, the brand’s category concentration and rank position together imply dependence on a narrow demand base where modest MoM lift is not offsetting structural YoY losses.
The combination of a 100.0% Edible mix and a 36 rank in Arizona signals a positioning anchored in a single format where slight MoM recovery (+5.99%) occurs against sustained YoY contraction (−24.31%). With price up 2.16% YoY and sales down 24.31% YoY, the pattern points to elasticity pressure and limited cross-category defensiveness; the implication is that maintaining share requires either deeper penetration within Edible or diversification beyond a single-category footprint.
Competitive Landscape
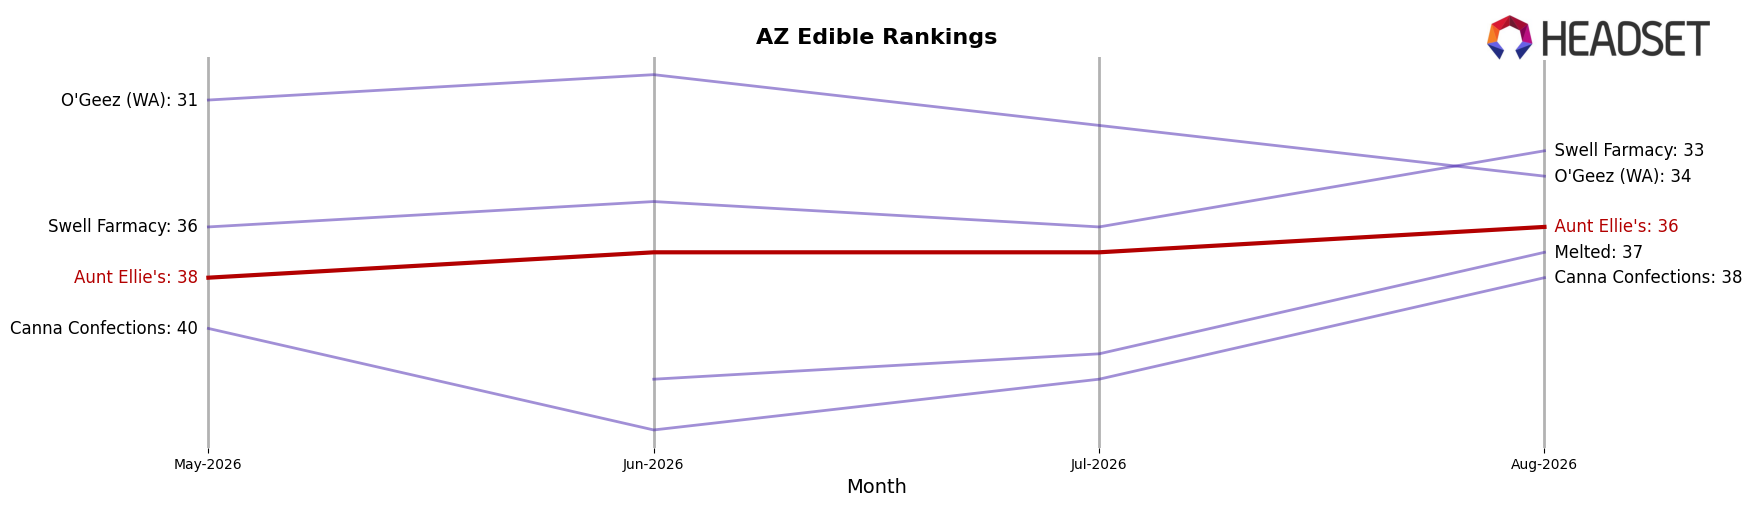
Aunt Ellie's sits at rank #36 in AZ Edible for August 2026, down 2 positions year over year from #34 and up 2 positions from #38 three months ago; its peak of #32 in April 2025 is 4 spots higher than today, indicating a net slide despite a recent quarter-on-quarter lift. At the top end, Wyld held steady at #1 year over year while its sales declined 19.2%, and OGEEZ remained at #2 with sales up 2.8%, showing that flat-to-rising leaders can maintain rank amid turbulence. In this context, Aunt Ellie's drift from #34 to #36 alongside a modest rebound from #38 suggests the brand is stabilizing below its April 2025 ceiling, implying a plateauing trajectory that requires share capture to avoid further rank erosion.
Notable Products
Homestyle Peanut Butter Cookies (100mg) delivered the standout movement in August 2026 with a 1113% month-over-month surge into rank 7, while Sativa Classic Brownie (100mg) fell 10.9% yet held rank 1, indicating volatility concentrated below the top slot. Indica Chocolate Brownie (100mg) jumped 266% to rank 6 and Extreme! Brownie (1000mg) rose 66.7% to rank 8, whereas Indica Classic Rice Cake Mellow (100mg) slid 44.5% at rank 5, pointing to sharp divergence within adjacent positions. With nine of the top ten as Edible SKUs and two separate items sharing rank 9, the cluster of brownies and cookies signals that Aunt Ellie's is consolidating around classic confection formats with momentum skewed to newly revived or previously under-distributed SKUs, implying near-term focus on scaling core edibles rather than extending into new categories.
Top Selling Cannabis Brands






Data for this report comes from real-time sales reporting by participating cannabis retailers via their point-of-sale systems, which are linked up with Headset’s business intelligence software. Headset’s data is very reliable, as it comes digitally direct from our partner retailers. However, the potential does exist for misreporting in the instance of duplicates, incorrectly classified products, inaccurate entry of products into point-of-sale systems, or even simple human error at the point of purchase. Thus, there is a slight margin of error to consider. Brands listed on this page are ranked in the top twenty within the market and product category by total retail sales volume.

