.svg)
Aug-2026
Sales
Trend
6-Month
Product Count
SKUs
Avg Price
YoY Sales Change
YoY Price Change


Where to Buy
Melted is stocked at 91 licensed dispensaries across Michigan, Washington, and Maryland, 62 of them in Michigan, with the deepest coverage in New Buffalo, Kalamazoo, Menominee, Adrian, and Ann Arbor. Search by ZIP code or city below to find the closest one, or filter by product type if you are after a specific format.
Market Insights Snapshot
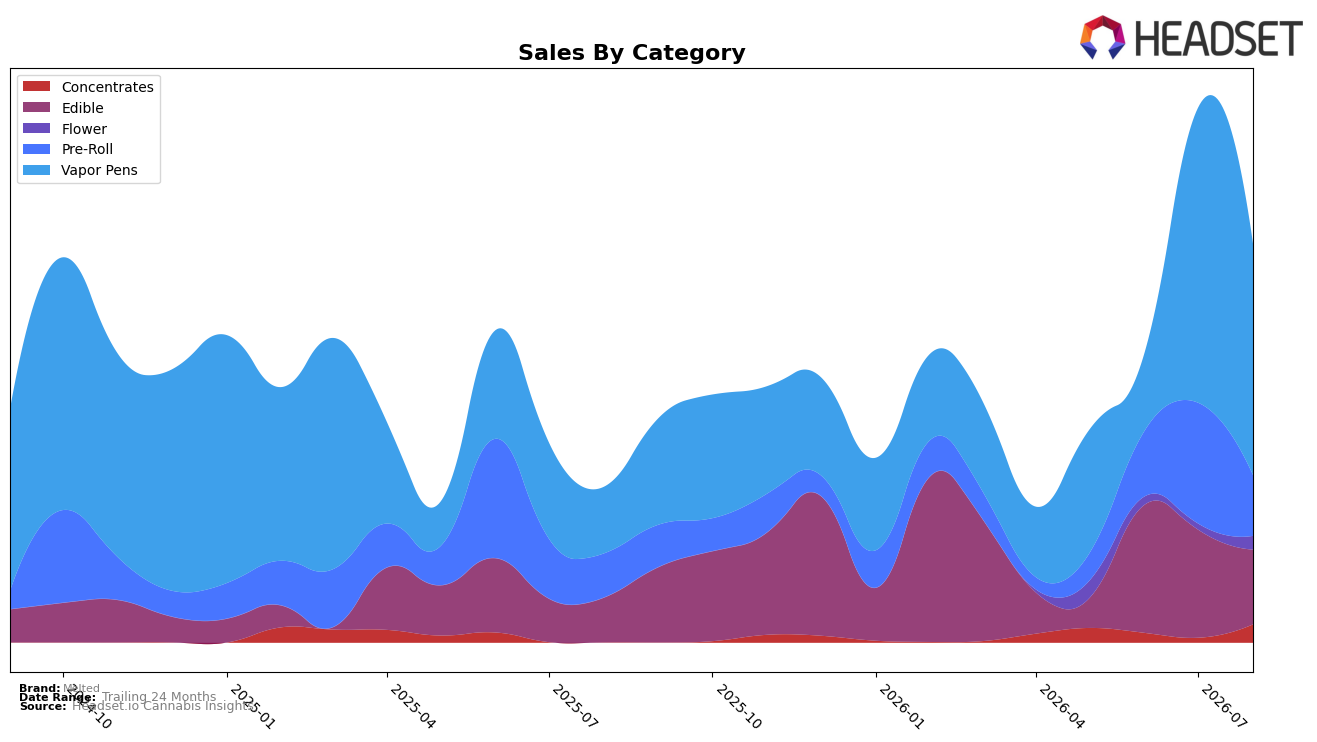
In August 2026, Melted concentrated 58.11% of sales in Vapor Pens with a 247.82% year-over-year lift but a 21.60% month-over-month decline, while Edible held 18.74% share with 67.28% YoY growth and a 31.01% MoM pullback. Pre-Roll accounted for 15.19% share with 37.94% YoY growth but a 49.89% MoM drop, as Concentrates jumped 280.67% MoM to 4.58% share and Flower rose 130.25% MoM to 3.38% share. The average price rose 15.17% YoY to $14.32 as Vapor Pens’ average price sat at $15.83 and Pre-Roll at $18.63, indicating a mix shift into higher-ticket formats despite month-on-month volume contraction across three core categories. The pattern implies Melted is expanding category breadth while leaning on Vapor Pens for scale, with short-term MoM retrenchment offset by outsized YoY growth in the anchor segment and opportunistic re-entry into Concentrates and Flower.
Melted’s positioning now tilts toward premium-adjacent inhalables: Vapor Pens’ 58.11% share and rank 49 in Vapor Pens in Maryland suggest headroom if MoM softness (-21.60% in Vapor Pens and -49.89% in Pre-Roll) can be stabilized, while the 280.67% MoM surge in Concentrates and 130.25% MoM gain in Flower signal emerging trial that could diversify risk. With brand sales up 156.93% YoY against a 15.17% YoY price increase, the thesis is volume-led growth where mix accretion from Vapor Pens and selective expansion in Concentrates and Flower can improve rank trajectory if Melted sustains Edible’s 67.28% YoY growth while moderating month-over-month volatility.
Competitive Landscape
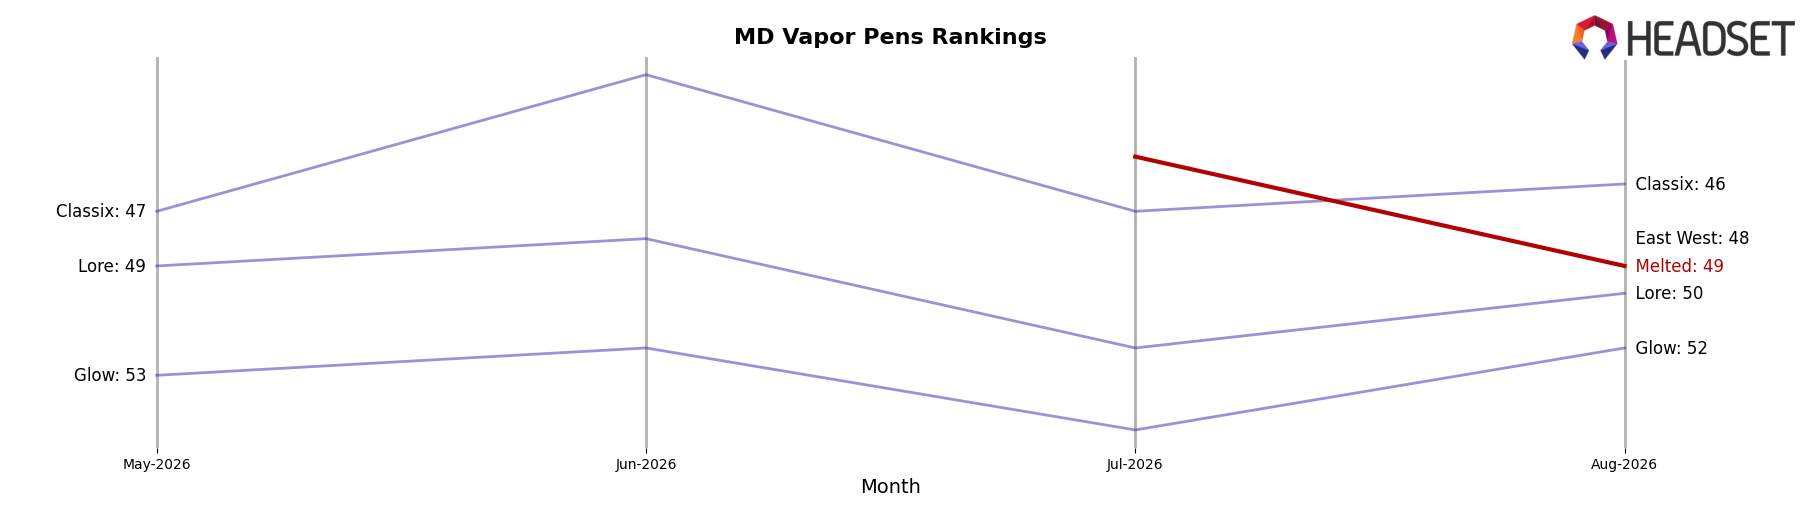
Melted sits at rank 49 in MD Vapor Pens for August 2026, with no year-over-year rank reported, and it previously peaked at rank 45 in July 2026; by contrast, Select holds rank 1 with a 37.0% YoY sales gain while RYTHM is rank 3 after sliding from rank 4 year over year alongside a 7.0% YoY sales decline. Further emphasizing the gap, Rove advanced to rank 5 from rank 11 year over year on a 125.3% YoY sales increase, whereas &Shine moved down to rank 4 from rank 3 with an 18.7% YoY decline, indicating that Melted’s drift from a peak of rank 45 to rank 49 amid rapid upward mobility by top-five players implies erosion of relative visibility unless it captures share from brands losing momentum.
Notable Products
Tiger Style- Thin Mint Girl Scout Cookies Distillate Cartridge (0.5g) posted the steepest decline in August 2026 at -78.8% and slid to rank 8, while Tiger Style- Super Silver Haze CDT Distillate Cartridge (0.5g) fell -44.8% to rank 9. In contrast, Super Silver Haze Distillate Disposable (0.5g) rose 10.5% to hold rank 1, and Wild Berry Live Resin Gummies 10-Pack (100mg) climbed 19.9% to rank 3. With five of the top ten in Vapor Pens but four Edible SKUs occupying ranks 2–6, the mix signals a pivot from breadth in pens toward steadier volume in gummies as the pen portfolio undergoes pruning.
Top Selling Cannabis Brands






Data for this report comes from real-time sales reporting by participating cannabis retailers via their point-of-sale systems, which are linked up with Headset’s business intelligence software. Headset’s data is very reliable, as it comes digitally direct from our partner retailers. However, the potential does exist for misreporting in the instance of duplicates, incorrectly classified products, inaccurate entry of products into point-of-sale systems, or even simple human error at the point of purchase. Thus, there is a slight margin of error to consider. Brands listed on this page are ranked in the top twenty within the market and product category by total retail sales volume.

