.svg)

Sep-2026
Sales
Trend
6-Month
Product Count
SKUs
Avg Price
YoY Sales Change
YoY Price Change


Where to Buy
AURA (CT) is stocked at 15 licensed dispensaries across Connecticut, with the deepest coverage in Norwalk, Canton, Hamden, Hartford, and Manchester. Search by ZIP code or city below to find the closest one.
Market Insights Snapshot
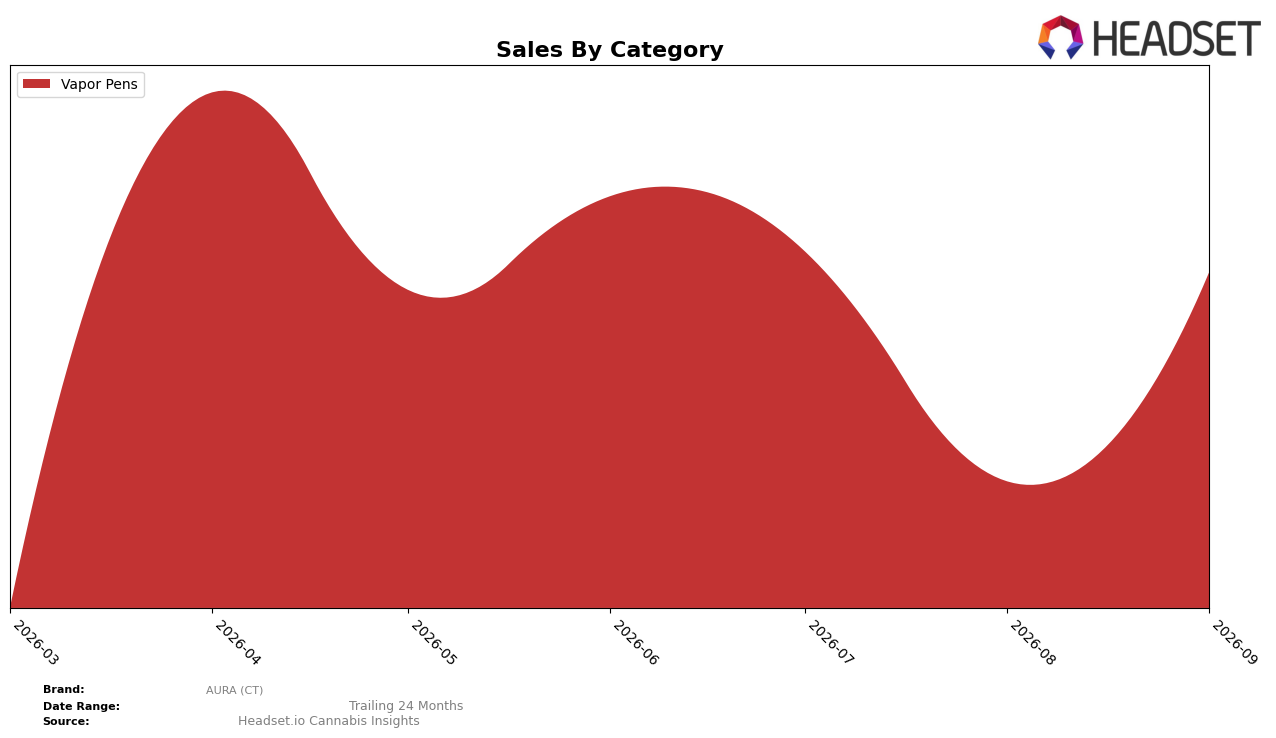
In September 2026, AURA (CT) operated as a single-category brand with Vapor Pens at 100.0% of sales share and an average price of $52.16, while month-over-month Vapor Pens sales rose 86.94% and the brand held rank 9 in Connecticut Vapor Pens. The absence of year-over-year data alongside an 86.94% MoM surge suggests a demand spike concentrated in a lone category, and rank 9 indicates headroom for upward movement if the momentum can be converted into sustained share gains.
The concentration at 100.0% in Vapor Pens and an 86.94% MoM lift, paired with rank 9 in Connecticut, implies positioning centered on velocity wins within a narrow portfolio rather than diversification, with pricing at $52.16 aligning the brand to compete on perceived quality rather than breadth. This pattern implies that maintaining MoM growth at 80%+ in a single category is unlikely to persist, so near-term positioning should leverage the Vapor Pens base to climb from rank 9 while testing adjacent formats to buffer volatility if MoM expansion normalizes.
Competitive Landscape
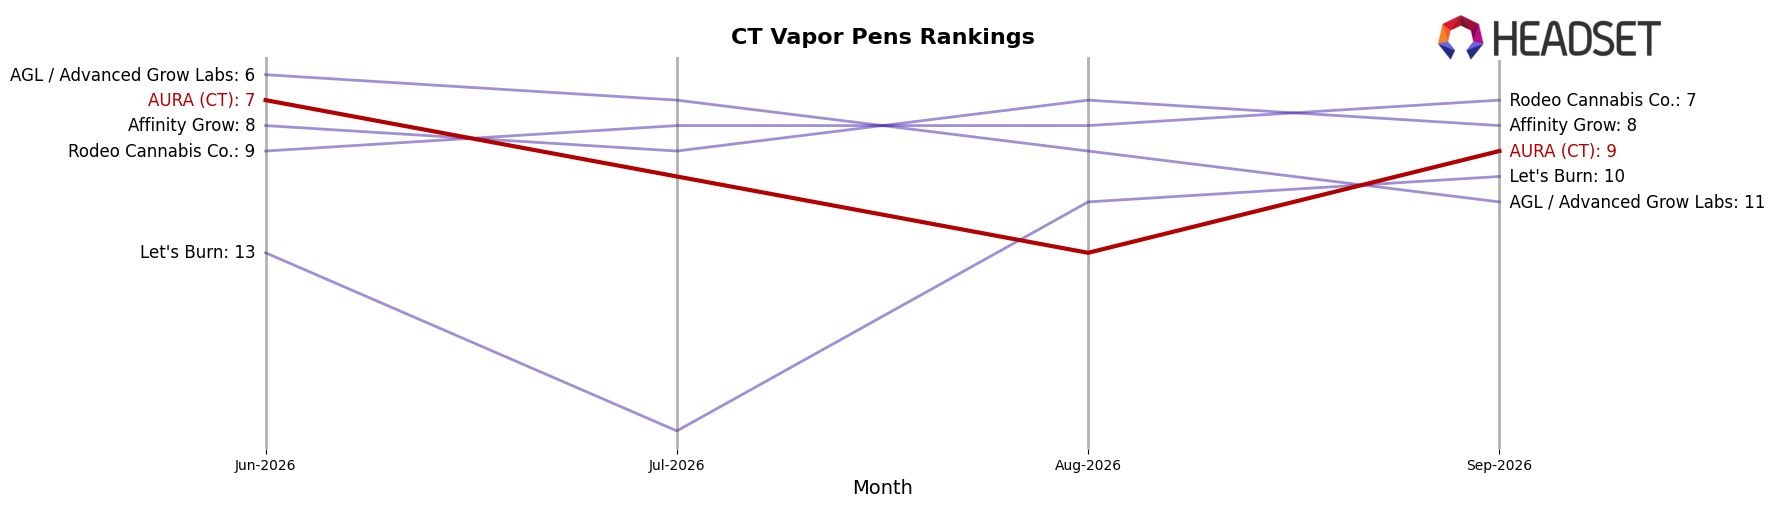
AURA (CT) sits at rank #9 in CT Vapor Pens as of September 2026, slipping 2 positions from #7 in June 2026 while remaining below its peak of #6 in April 2026; meanwhile, Select moved to #1 with a +3 YoY rank change and an 84% YoY sales increase, and Soundview is now #5 after a +15 YoY rank climb alongside a 509% YoY sales surge. With Theraplant at #4 despite a 48% YoY sales decline and Lighthouse Cannabis Company at #2 with a +4 YoY rank gain and 53% YoY sales growth, AURA (CT)’s 3-to-9 slide over three months implies share is being redistributed toward brands with sharper YoY momentum, signaling near-term pressure on AURA (CT)’s rank unless it reverses recent quarterly drift.
Notable Products
Super Lemon Haze Distillate Disposable (1g) posted the headline move in September 2026 with a +856.7% month-over-month surge to $35,435 while debuting at rank 4, outpacing the also-sharp +441.9% climb of Pineapple Express Distillate Disposable (1g) to rank 1. In contrast, Kush Mints Distillate Disposable (1g) slipped -19.2% to rank 2 and Tahoe OG Distillate Disposable (1g) fell -20.6% to rank 3, even as Sour Diesel Distillate Disposable (1g) advanced +343.7% and Cake OG Distillate Disposable (1g) rose +252.4% into rank 6. With all top-6 SKUs in Vapor Pens and four of the top five posting triple-digit MoM gains, the mix signals a pivot toward rapid-share capture via a refreshed disposable lineup despite volatility among incumbent strains.
Top Selling Cannabis Brands






Data for this report comes from real-time sales reporting by participating cannabis retailers via their point-of-sale systems, which are linked up with Headset’s business intelligence software. Headset’s data is very reliable, as it comes digitally direct from our partner retailers. However, the potential does exist for misreporting in the instance of duplicates, incorrectly classified products, inaccurate entry of products into point-of-sale systems, or even simple human error at the point of purchase. Thus, there is a slight margin of error to consider. Brands listed on this page are ranked in the top twenty within the market and product category by total retail sales volume.

