.svg)

Aug-2026
Sales
Trend
6-Month
Product Count
SKUs
Avg Price
YoY Sales Change
YoY Price Change


Where to Buy
Bubbles is stocked at 53 licensed dispensaries across Missouri, with the deepest coverage in St. Louis, Kansas City, Columbia, Lees Summit, and Joplin. Search by ZIP code or city below to find the closest one, or filter by product type if you are after a specific format.
Market Insights Snapshot
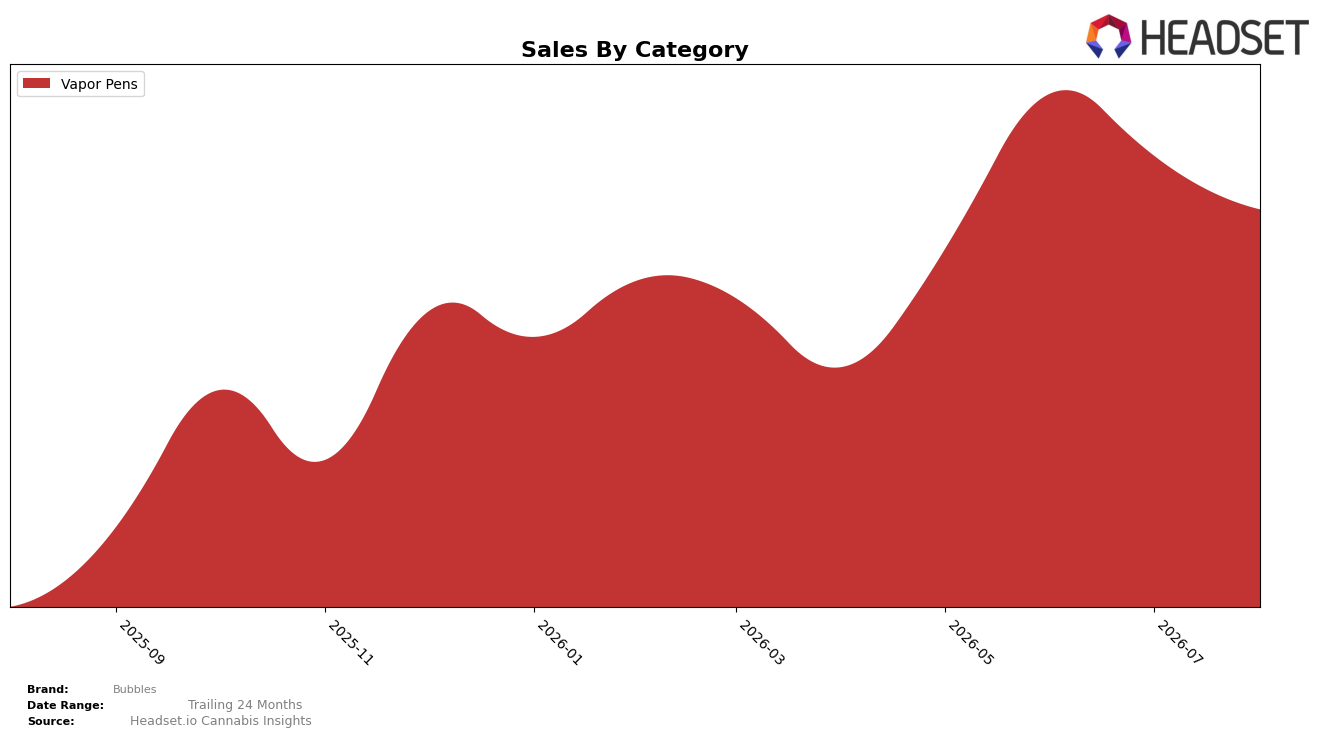
In August 2026, Bubbles concentrated 100.0% of sales in Vapor Pens, with category sales down 8.66% month over month but up 233.02% year over year, indicating a single-category strategy that scaled rapidly across the annual window while contracting sequentially. Average price rose 3.99% year over year to $42.20 while the brand’s category rank in Vapor Pens sat at 38 in Missouri, a pairing that implies demand growth was volume-led over the year even as monthly softness suggests sensitivity to recent pricing or promotional pullback.
The shift toward a fully concentrated Vapor Pens mix at 100.0%, combined with a 233.02% year-over-year sales increase and an 8.66% month-over-month decline, implies Bubbles is positioned as a focused specialist rather than a portfolio balancer, trading broader category diversification for depth in a single lane. With an average price up 3.99% year over year to $42.20 and a rank of 38 in Missouri, the pattern points to a mid-pack price-position where incremental share gains will likely depend on mix within Vapor Pens (e.g., hardware vs. carts, potency tiers) and improved retail velocity rather than further price moves.
Competitive Landscape
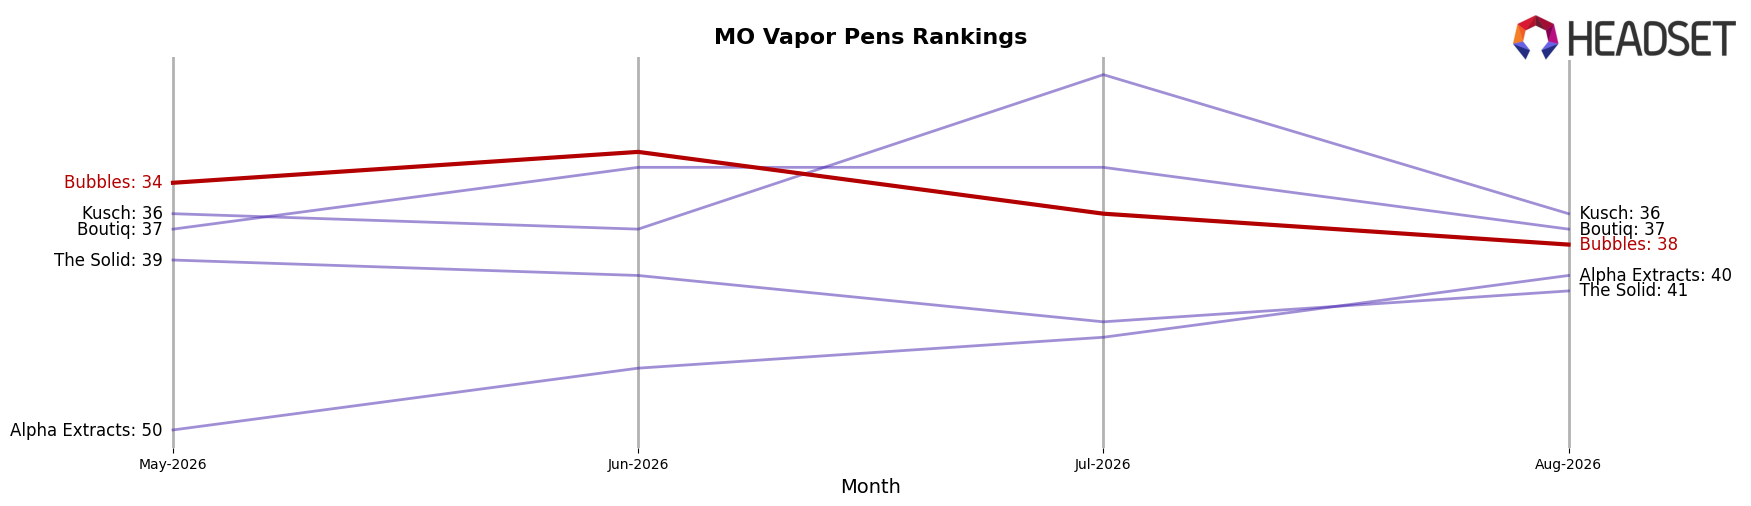
Bubbles sits at rank #38 in MO Vapor Pens in August 2026, climbing 18 positions from #56 year over year, but slipping 4 spots from #34 since May–August, and down 6 places from its peak at #32 in June 2026; meanwhile, Illicit / Illicit Gardens moved from #2 to #1 and Galactic advanced from #3 to #2, indicating top-tier upward pressure as Good Day Farm jumped from #7 to #3 with a 59.1% YoY sales increase and Pinpoint rose from #6 to #4 with a 45.5% YoY lift. The combination of an 18-rank YoY gain alongside a 4-rank three-month slide implies Bubbles is improving its baseline position but losing momentum against faster-climbing leaders, signaling a need to defend mid-pack share before the category’s top five consolidate further.
Notable Products
Atomic Burst Distillate Disposable (1g) set the tone in August 2026 with a -13.7% month-over-month decline while holding the number 1 rank, and Blue Raz Distillate Disposable (1g) slid -18.8% at rank 4, indicating price-sensitive elasticity at the top end. In contrast, Breezy Blast Distillate Disposable (1g) rose 7.9% MoM at rank 5 while Watermelon Ice Distillate Disposable (1g) dipped -1.0% at rank 2, suggesting mid-tier flavors are absorbing demand as top flavors cool. With six of the top ten slots occupied by Vapor Pens and aggregate sales for the leader at $54,751, the category concentration points to a need for flavor rotation and promotional pacing to stabilize the flagship while nurturing fast followers.
Top Selling Cannabis Brands






Data for this report comes from real-time sales reporting by participating cannabis retailers via their point-of-sale systems, which are linked up with Headset’s business intelligence software. Headset’s data is very reliable, as it comes digitally direct from our partner retailers. However, the potential does exist for misreporting in the instance of duplicates, incorrectly classified products, inaccurate entry of products into point-of-sale systems, or even simple human error at the point of purchase. Thus, there is a slight margin of error to consider. Brands listed on this page are ranked in the top twenty within the market and product category by total retail sales volume.

