.svg)
Aug-2026
Sales
Trend
6-Month
Product Count
SKUs
Avg Price
YoY Sales Change
YoY Price Change


Market Insights Snapshot
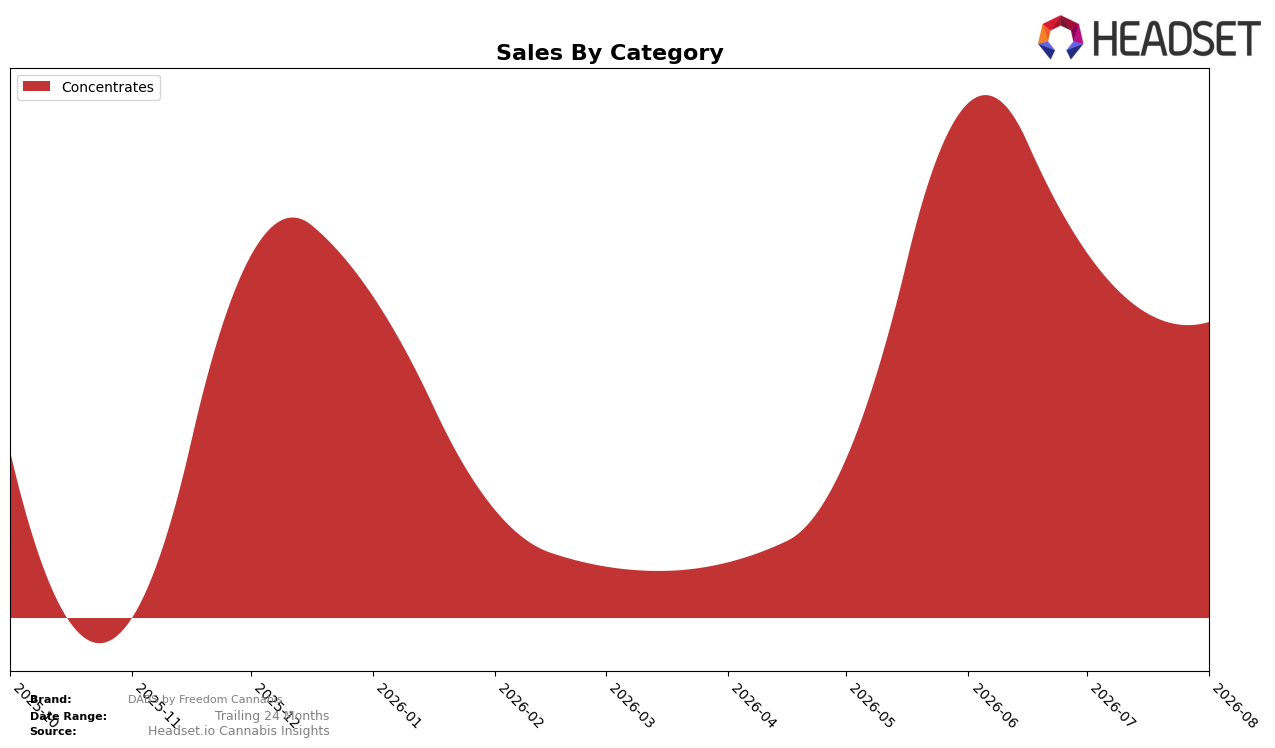
In August 2026, DABS by Freedom Cannabis operated as a single-category brand with Concentrates at 100.0% of mix, paired with a month-over-month sales change of -15.19% and an average price of $25.90. With no year-over-year percentage available and no secondary categories contributing share, the brand’s mix concentration is absolute at 100.0% while intra-category momentum is negative at -15.19% MoM, implying exposure to category cyclicality rather than portfolio-driven cushioning.
The full reliance on Concentrates at 100.0% share alongside a rank of 30 in Alberta points to a positioning anchored in a niche rather than a diversified footprint, with price at $25.90 constraining trade-up options if unit trends soften. The -15.19% MoM decline, combined with a 100.0% category dependency, implies that near-term performance will be driven more by shelf velocity within the Concentrates set than by cross-category expansion, suggesting that incremental distribution or pack-size/format tactics within Concentrates would be more impactful than pricing alone at the current rank of 30.
Competitive Landscape
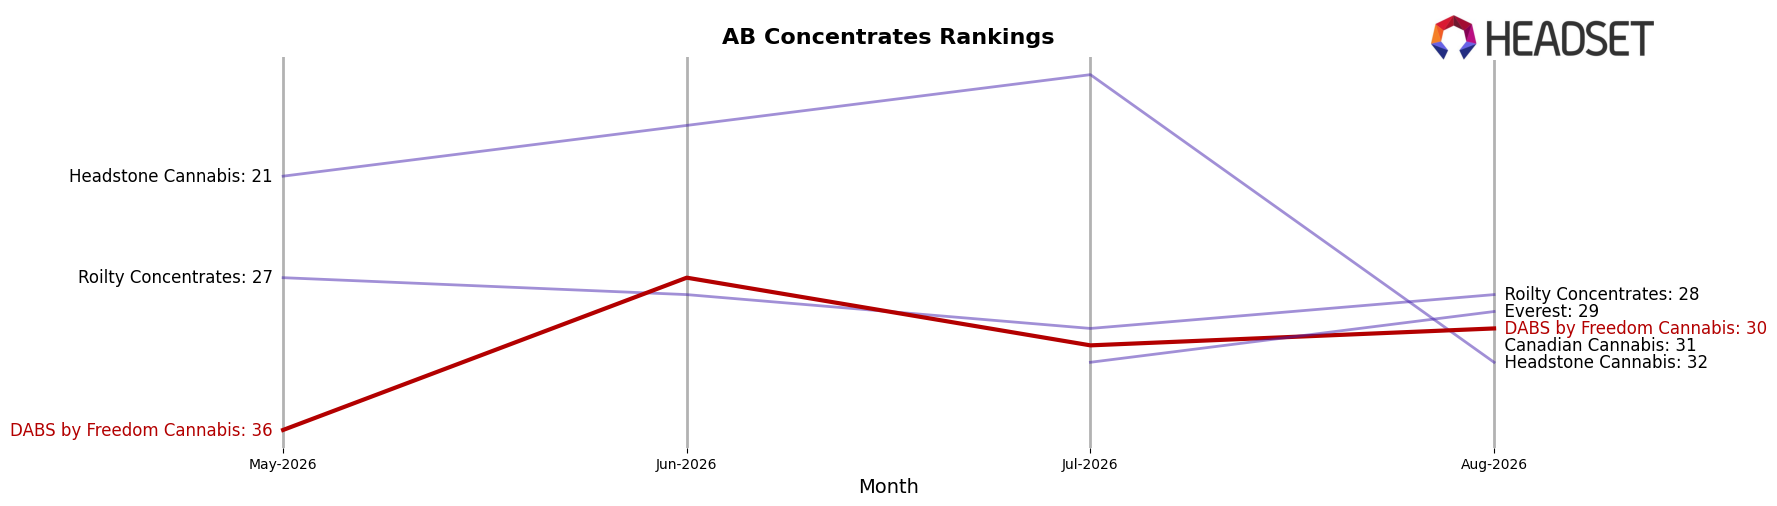
DABS by Freedom Cannabis sits at rank #30 in August 2026, improving 7 positions from #37 in May 2026 and sitting 3 spots below its peak of #27 in June 2026; with year-over-year rank unavailable, the near-term climb of 18.9% in rank position versus three months prior contrasts with a 10.0% slippage from its peak. Among competitors, BoxHot holds #1 while posting a -2.6% year-over-year sales change, and Sticky Greens jumped to #5 from #49 year-over-year with a 1486.7% sales increase, indicating that DABS by Freedom Cannabis is gaining tactically in mid-table ranks while top-tier volatility and outsized growth at the upper end raise the bar for sustained advancement; the trajectory implies a window to consolidate around the high-20s before attempting another step-change in rank.
Notable Products
Slurricane FSE Cured Resin (1g) posted the steepest decline at -34.9% MoM and slid to rank 4 in August 2026, while Orange Kush Cake FSE Cured Resin (1g) surged +51.7% MoM to rank 2. Black Mountain Side FSE Cured Resin (1g) held rank 1 but contracted -27.4% MoM, creating a widening gap in momentum between the leader and the riser. With all top-4 SKUs in Concentrates and three of the top four carrying FSE Cured Resin formats, the portfolio is concentrated in a single texture that is seeing divergent demand curves, implying the brand is leaning into a narrow form factor that now requires SKU-level pruning and rotation to sustain rank density.
Top Selling Cannabis Brands






Data for this report comes from real-time sales reporting by participating cannabis retailers via their point-of-sale systems, which are linked up with Headset’s business intelligence software. Headset’s data is very reliable, as it comes digitally direct from our partner retailers. However, the potential does exist for misreporting in the instance of duplicates, incorrectly classified products, inaccurate entry of products into point-of-sale systems, or even simple human error at the point of purchase. Thus, there is a slight margin of error to consider. Brands listed on this page are ranked in the top twenty within the market and product category by total retail sales volume.

