.svg)

Aug-2026
Sales
Trend
6-Month
Product Count
SKUs
Avg Price
YoY Sales Change
YoY Price Change


Market Insights Snapshot
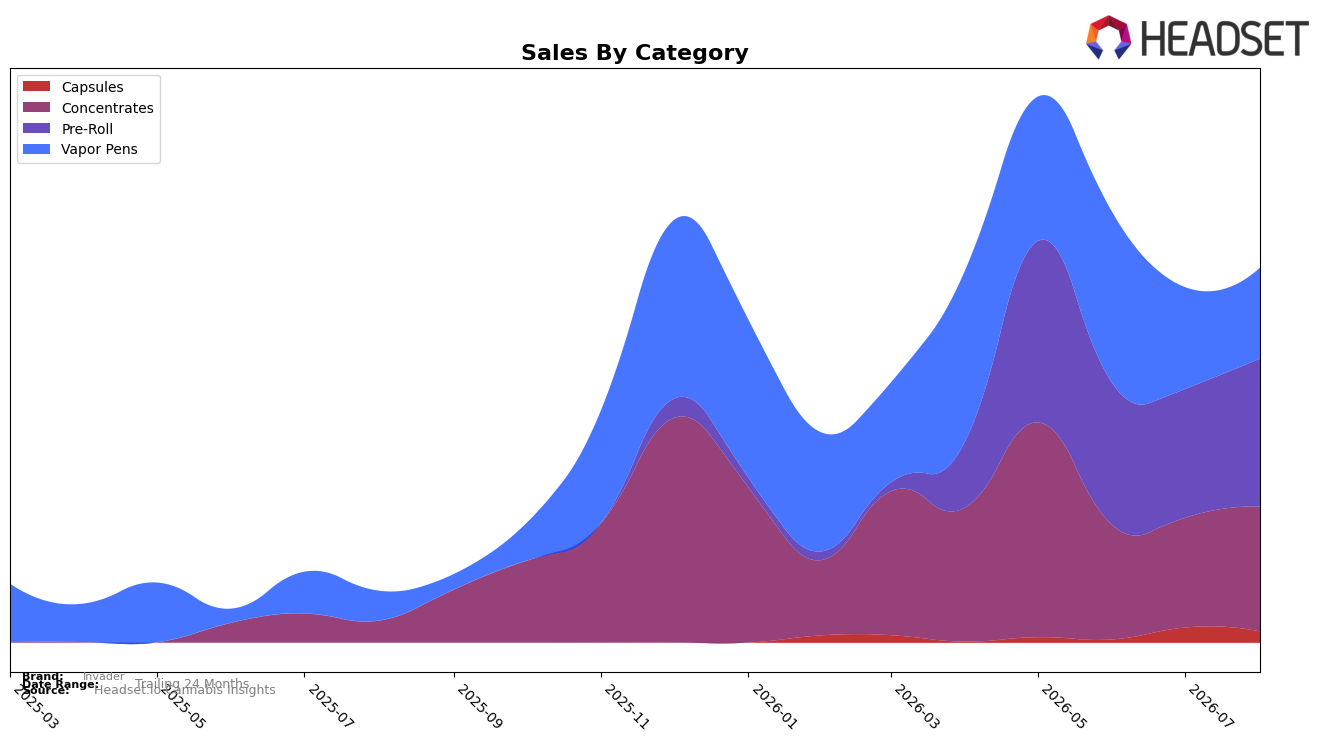
In August 2026, Invader’s mix tilted toward Pre-Roll at 39.41% share with month-over-month growth of 14.78%, while Concentrates held 33.34% share with a 13.88% MoM increase; by contrast, Vapor Pens accounted for 24.25% share but declined 10.64% MoM, and Capsules at 2.99% fell 25.88% MoM. On a year-over-year basis, Concentrates expanded 473.98% and Vapor Pens rose 207.67%, while brand-level average price fell 27.50% and overall sales grew 630.39% YoY, implying a price-led volume expansion. The combination of double-digit MoM gains in Pre-Roll and Concentrates alongside a MoM pullback in Vapor Pens suggests Invader is concentrating growth around value-accessible inhalables while trimming exposure to slower-moving form factors.
Given a Pre-Roll rank of 87 in Alberta and a Pre-Roll share near 40% alongside a 14.78% MoM increase, Invader’s near-term positioning depends on converting price-driven trial into sustained repeat in its largest category while using the 473.98% YoY surge in Concentrates to diversify the demand base. With Vapor Pens down 10.64% MoM despite 207.67% YoY growth and Capsules shrinking 25.88% MoM, the portfolio skews toward fast-turn SKUs, indicating a need to defend Pre-Roll shelf presence at rank 87 while selectively scaling Concentrates to hedge volatility and lift overall mix value.
Competitive Landscape
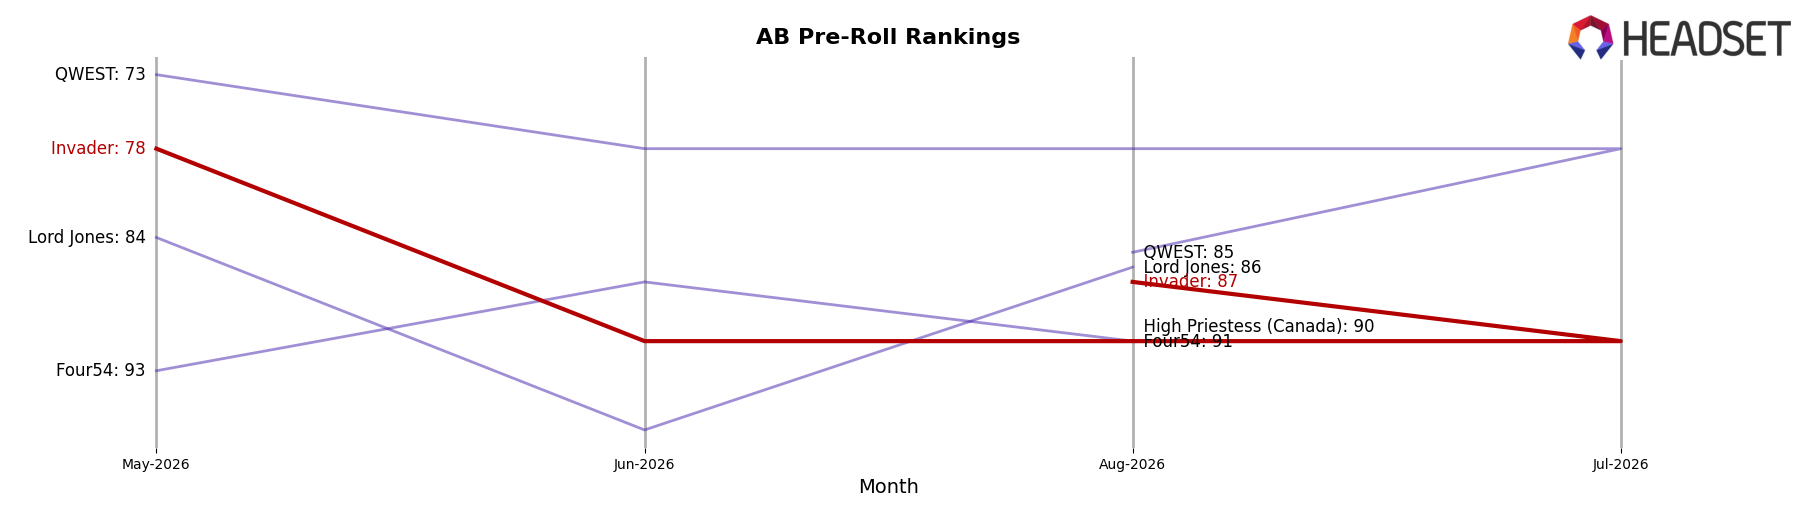
Invader sits at #88 in AB Pre-Roll in August 2026, sliding 10 spots from #78 in May 2026 while lacking a published year-over-year rank, whereas Back Forty / Back 40 Cannabis is #1 after a 5-place YoY climb and General Admission holds #2 despite a 1-rank YoY improvement paired with a −20.8% YoY sales change. Over the latest quarter, Invader fell from #78 in May 2026 to #88 in August 2026 (a 10-rank drop), while Thumbs Up Brand advanced to #4 with an 18-rank YoY rise and +135.1% YoY sales, and Space Race Cannabis is #3 with a 2-rank YoY lift despite −25.2% YoY sales, implying Invader’s downward rank trajectory reflects share loss amid competitors that are either converting momentum into rank (e.g., Thumbs Up Brand) or defending top-tier positions despite contraction.
Notable Products
The steepest movement came from Overlord Live Resin Disposable (1g), which fell 56.1% month over month and slid to rank 6, while Hybrid Live Rosin Tablets 20-Pack (200mg) declined 25.9% to rank 5. In contrast, Pure Live Rosin Disposable (0.5g) rose 41.9% to rank 2 and Overlord Live Rosin Infused Pre-Roll (1g) climbed 15.8% while holding rank 1, indicating momentum in solventless formats despite volatility in resin-based disposables. With two Vapor Pens in the top ten moving in opposite directions and Concentrates placing three SKUs in ranks 3, 7, and 8, the mix points to Invader leaning into live rosin-led potency while phasing down legacy resin SKUs.
Top Selling Cannabis Brands






Data for this report comes from real-time sales reporting by participating cannabis retailers via their point-of-sale systems, which are linked up with Headset’s business intelligence software. Headset’s data is very reliable, as it comes digitally direct from our partner retailers. However, the potential does exist for misreporting in the instance of duplicates, incorrectly classified products, inaccurate entry of products into point-of-sale systems, or even simple human error at the point of purchase. Thus, there is a slight margin of error to consider. Brands listed on this page are ranked in the top twenty within the market and product category by total retail sales volume.

