

Sep-2026
Sales
Trend
6-Month
Product Count
SKUs
Avg Price
YoY Sales Change
YoY Price Change


Where to Buy
Elite Xtractions is stocked at 23 licensed dispensaries across Michigan, with the deepest coverage in Ann Arbor, Inkster, Pontiac, Coldwater, and Constantine. Search by ZIP code or city below to find the closest one, or filter by product type if you are after a specific format.
Market Insights Snapshot
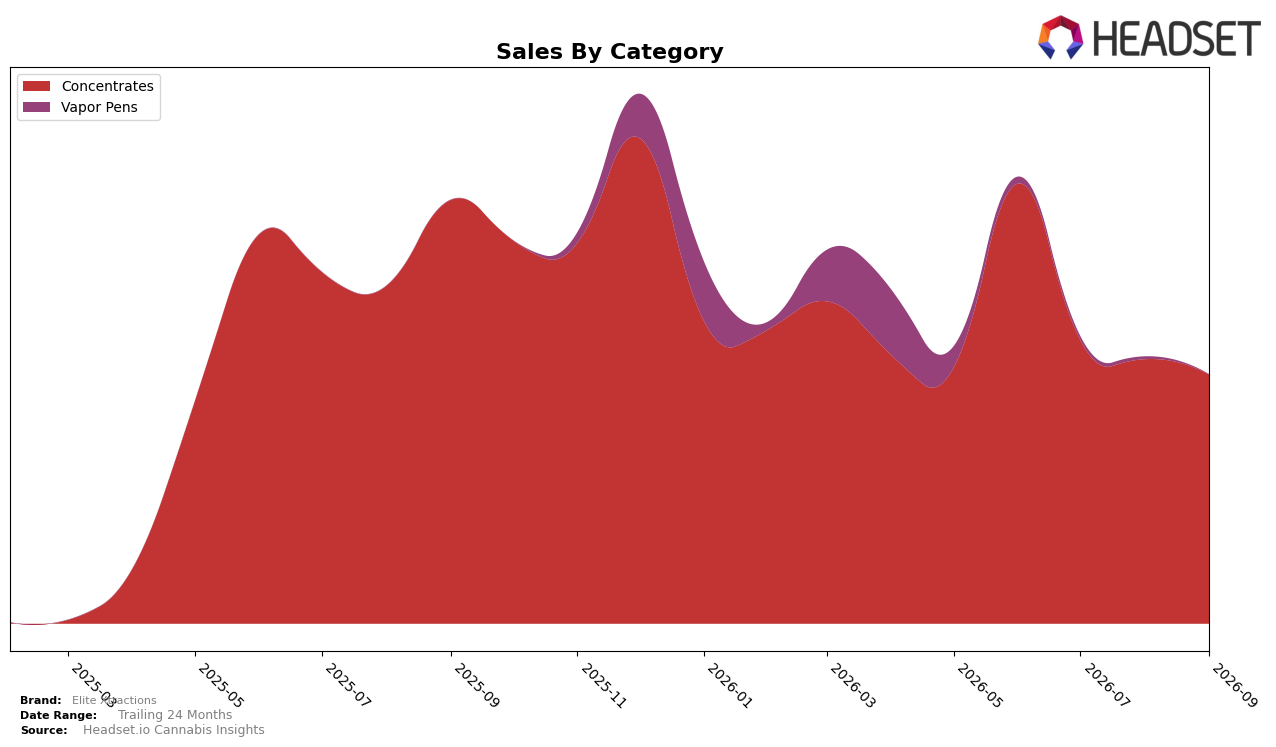
Elite Xtractions operated as a single-category brand in September 2026, with Concentrates accounting for 100.0% of sales and a year-over-year decline of 41.26% alongside a month-over-month dip of 5.86%. Average price fell 4.02% YoY to $6.25, while the brand held rank 43 in Concentrates within Michigan, indicating mid-pack positioning despite full category concentration. The pattern implies a narrowing funnel: a monoline mix amplifies exposure to category-specific headwinds, so the 41.26% YoY contraction paired with a 5.86% MoM drop signals that category drag, not just pricing, is the core limiter.
With all volume tied to Concentrates and rank fixed at 43 in Michigan, the 4.02% YoY price decrease did not offset unit softness implied by the 41.26% YoY sales decline and 5.86% MoM slide. The mix rigidity (100.0% in Concentrates) means share and rank will be driven more by unit throughput than by small price moves, and the current price compression suggests limited room for tactical discounting to regain share in the near term.
Competitive Landscape
Elite Xtractions sits at rank #43 in MI Concentrates in September 2026, a 18-position drop from its #25 peak in September 2025 and down 12 ranks from #31 three months ago, while category leaders moved in the opposite direction: Rkive Cannabis climbed to #1 from #3 year over year with 130.9% sales growth and Uniq Pressure surged to #3 from #96 with a 2,216.9% YoY lift; even The Limit advanced from #1 to #2 as Cannalicious Labs fell from #2 to #4 with a 38.5% YoY sales decline, indicating Elite Xtractions is losing share position while rivals consolidate the top five, and the trajectory implies the brand must counter accelerating upmarket mobility by re-entering the top 30 to avoid a slide toward long-tail visibility.

Notable Products
Guava Bars Cured Resin (1g) posted the steepest decline in September 2026, falling 44.9% MoM while sliding to rank 10, and Glitter Bomb Cured Resin (1g) fell 28.0% MoM at rank 9, signaling acute softness at the lower end of the top 10. Meanwhile, Runtz Cured Resin (1g) held rank 1 and Lemon Slam Micro Diamonds (1g) sat at rank 2 with $5,547 in sales, and Mandarin Gushers Cured Resin (1g) dipped 3.1% MoM at rank 7, together indicating stability at the top despite tail-end erosion. With all top-10 SKUs concentrated in Concentrates and multiple cured resins anchoring ranks 1, 3, and 6–7, the mix implies a deliberate tilt toward resin-led offerings while pruning underperforming variants.
Top Selling Cannabis Brands

Data for this report comes from real-time sales reporting by participating cannabis retailers via their point-of-sale systems, which are linked up with Headset’s business intelligence software. Headset’s data is very reliable, as it comes digitally direct from our partner retailers. However, the potential does exist for misreporting in the instance of duplicates, incorrectly classified products, inaccurate entry of products into point-of-sale systems, or even simple human error at the point of purchase. Thus, there is a slight margin of error to consider. Brands listed on this page are ranked in the top twenty within the market and product category by total retail sales volume.

