.svg)
Aug-2026
Sales
Trend
6-Month
Product Count
SKUs
Avg Price
YoY Sales Change
YoY Price Change


Market Insights Snapshot
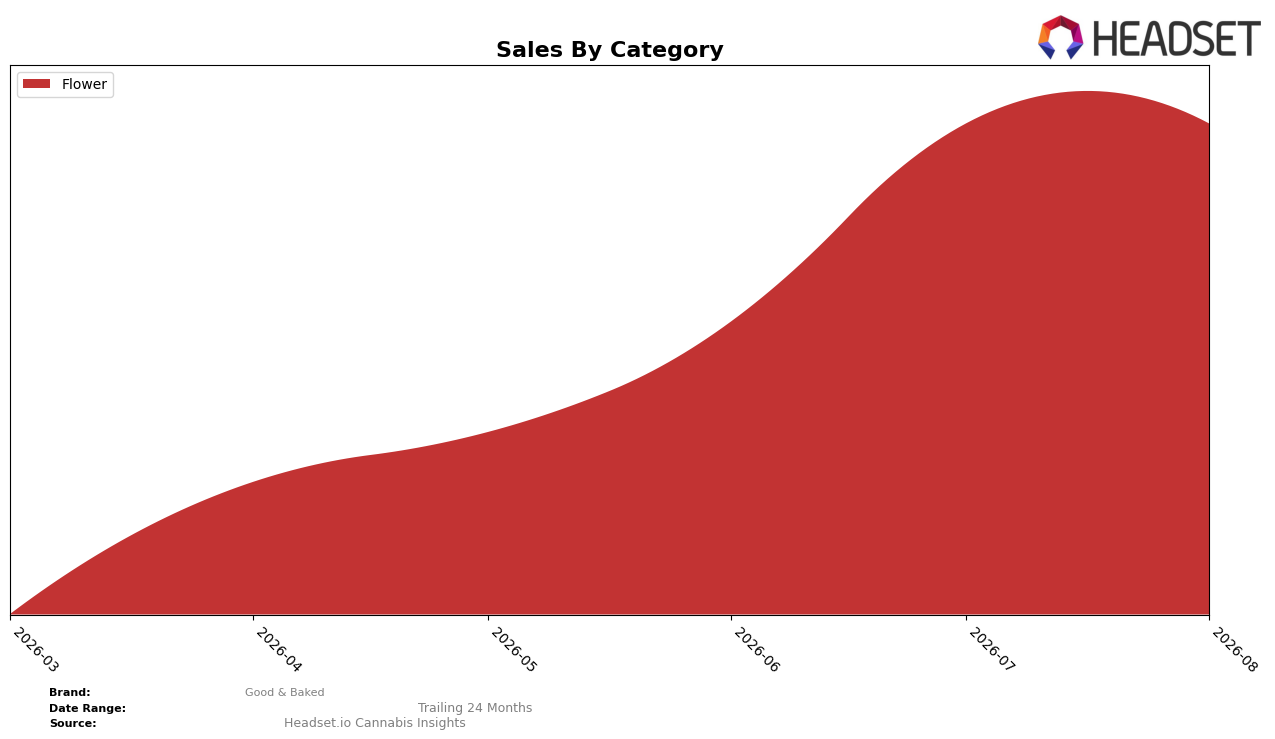
In August 2026, Good & Baked operated as a single-category brand with Flower at 100.0% of mix and an average price of $52.51, while month-over-month sales in Flower dipped by 1.85% and the category rank in British Columbia sat at 13. With no year-over-year percentage reported for Flower and a complete reliance on one category, the combination of a 100.0% concentration and a 1.85% MoM decline implies sensitivity to short-cycle demand shifts rather than diversification benefits.
The 13 rank in British Columbia alongside a 100.0% Flower concentration and a 1.85% MoM sales contraction suggests a positioning anchored in mid-tier shelf presence where price and strain rotation likely drive outcomes. The pattern implies that maintaining or improving the 13 rank will depend more on micro-adjustments—such as price points near $52.51 and SKU breadth—than on cross-category expansion, because any further 1–3% short-term dips would directly translate into total-brand movement given the 100.0% Flower exposure.
Competitive Landscape
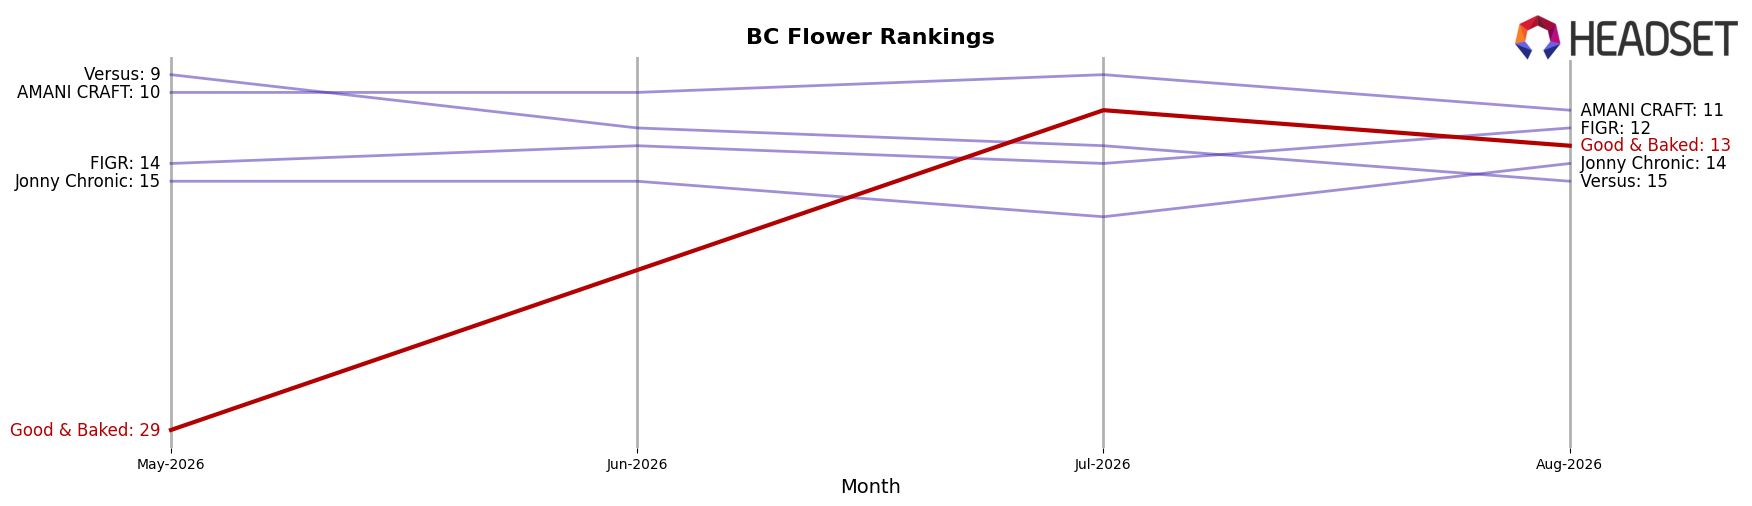
Good & Baked sits at rank #13 in BC Flower in August 2026, improving 16 positions from #29 in May 2026 and coming off a peak of #11 in July 2026; the absence of a year-over-year rank makes the three-month climb the salient comparator. While Big Bag O' Buds holds #1 with a +33.8% YoY sales lift and Spinach rose from #4 to #2 with +54.2% YoY sales growth, Good & Baked’s move from #29 to #13 in a quarter signals momentum specifically in recent months rather than across the full year. The juxtaposition of a July 2026 peak at #11 followed by a two-spot slip to #13 in August 2026, alongside competitors rising into the top 3, implies that Good & Baked’s rank trajectory is upward but still vulnerable to faster YoY climbers, pointing to a consolidation phase where sustaining double-digit rank gains will be the determinant of breaking into the top 10.
Notable Products
Cherry Pop Tartz (3.5g) posted the sharpest movement in August 2026 with a -50.1% month-over-month drop and slid to rank 5, while Tyson OG (14g) fell -34.3% and held rank 2, signaling pressure on both value and premium tiers. Moby Dick (14g) declined -8.4% but remained at rank 1, and four of the top ten are Flower SKUs in 14g formats, indicating a continued tilt toward larger pack sizes despite volatility in 3.5g. Where's My Bike? (14g) entered at rank 3 with $95,888 in sales and, along with Gelato Sweet Tea (14g) at rank 4, helped offset steep declines in several 3.5g items; the pattern implies Good & Baked is consolidating demand around core 14g Flower offerings while pruning underperforming 3.5g SKUs.
Top Selling Cannabis Brands






Data for this report comes from real-time sales reporting by participating cannabis retailers via their point-of-sale systems, which are linked up with Headset’s business intelligence software. Headset’s data is very reliable, as it comes digitally direct from our partner retailers. However, the potential does exist for misreporting in the instance of duplicates, incorrectly classified products, inaccurate entry of products into point-of-sale systems, or even simple human error at the point of purchase. Thus, there is a slight margin of error to consider. Brands listed on this page are ranked in the top twenty within the market and product category by total retail sales volume.

