.svg)
Aug-2026
Sales
Trend
6-Month
Product Count
SKUs
Avg Price
YoY Sales Change
YoY Price Change


Market Insights Snapshot
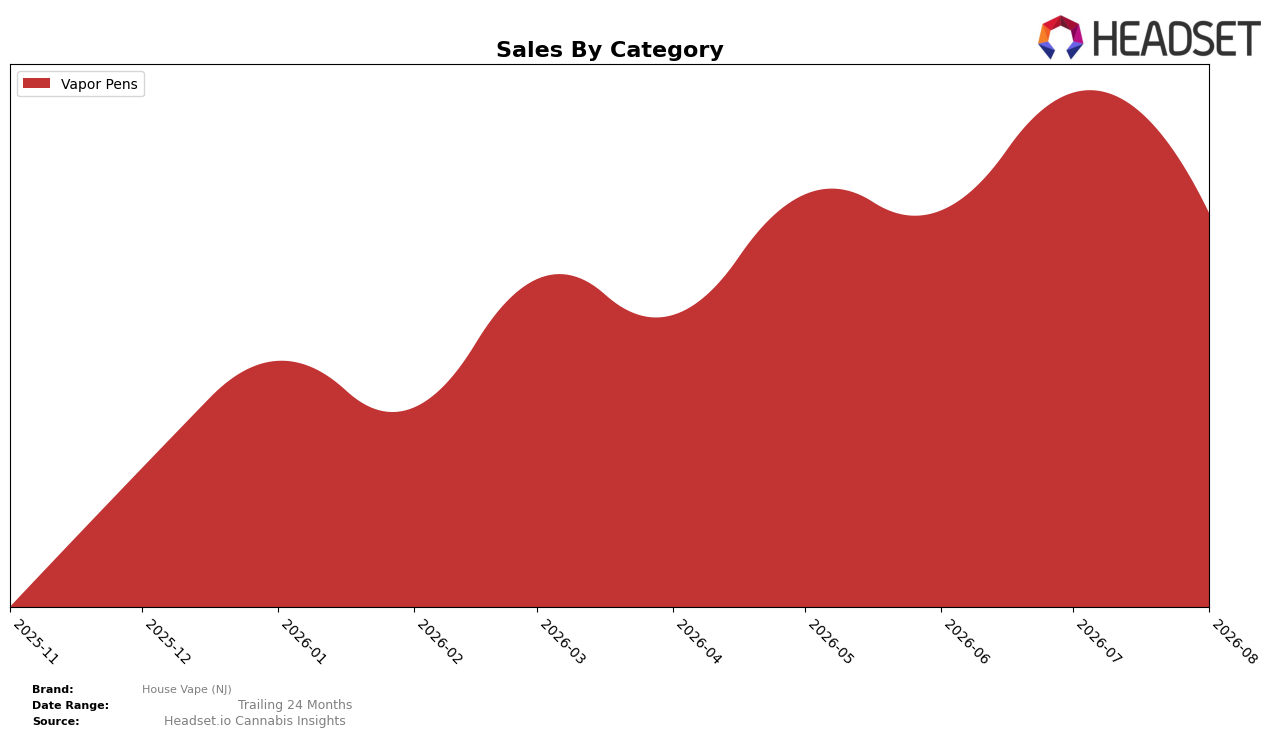
In August 2026, House Vape (NJ) operated as a single-category brand, with Vapor Pens accounting for 100.0% category share and an average price of $36.13. Within Vapor Pens, month-over-month sales declined by 20.20%, while New Jersey market rank in Vapor Pens sat at position 44, pointing to a narrowed footprint despite a stable 100.0% mix. The pattern implies a concentration risk: a pure-play Vapor Pens focus amplifies exposure to category swings, and a 20.20% month-over-month contraction alongside rank 44 signals that mix diversification or subsegment shifts within Vapor Pens may be required to stabilize momentum.
Positioning-wise, anchoring entirely in Vapor Pens at 100.0% share combined with a rank of 44 suggests limited defensibility if pricing or promotion pressure persists in New Jersey, especially after a 20.20% month-over-month decline. With August 2026 average price at $36.13 and no offsetting categories to absorb volatility, House Vape (NJ) trades flexibility for focus; this setup implies the brand must either deepen differentiation within Vapor Pens to climb from rank 44 or introduce adjacent formats to reduce the sensitivity observed in the 20.20% month-over-month swing.
Competitive Landscape
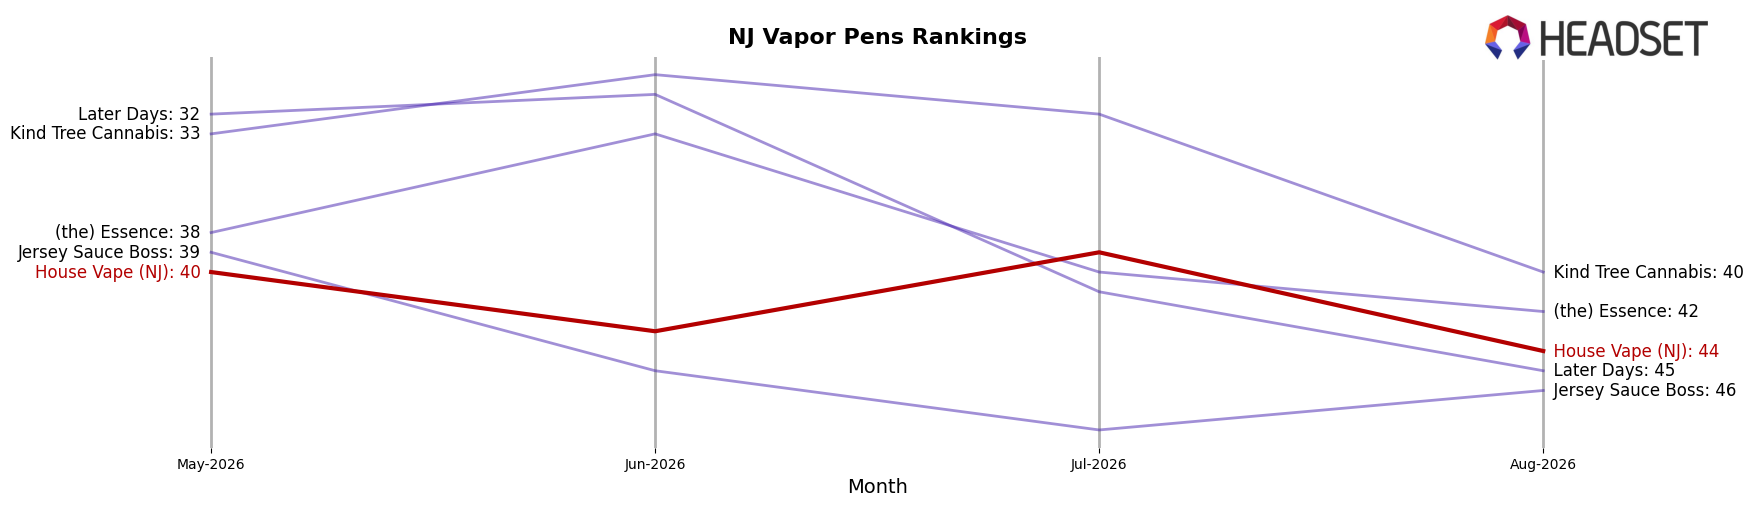
House Vape (NJ) sits at rank #44 in NJ Vapor Pens for August 2026, down 4 positions from #40 in May 2026, and off its peak of #39 in July 2026 by 5 spots; without a published year-over-year rank, the three-month slide from #40 to #44 places it further from the top tier where Select holds #1 despite a -21.18% sales YoY decline and Fernway holds #2 with +4.86% sales YoY. Compared with RYTHM, which climbed two ranks YoY to #5 alongside +14.04% sales YoY, House Vape (NJ)’s drop from #39 in July 2026 to #44 in August 2026 indicates lost share of voice at the shelf while leaders with mixed YoY sales trajectories maintain superior placement; the pattern implies that recovering into the 30s will require reversing month-to-month rank erosion rather than relying on overall category softness at the top.
Notable Products
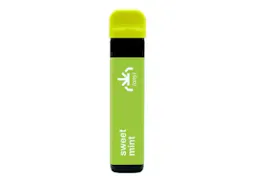
Plain Slice Distillate Disposable (1g) posted the steepest decline in August 2026 at -28.5% MoM, while Boardwalk Lemonade Distillate Disposable (1g) fell -12.6% but still held rank 1. Dr. Terpepper Distillate Disposable (1g) dropped -17.4% as it sat at rank 4, whereas Red Dr.ank Distillate Disposable (1g) in rank 2 was nearly flat at +1.3%, indicating price-sensitive demand clustering at the very top despite broad pullbacks. With all top-ten items in Vapor Pens and two Orange Slice formats occupying ranks 8 and 9, the assortment is concentrated in flavor-led disposables, implying House Vape (NJ) is prioritizing breadth of SKUs within a single form factor over diversifying into new categories.
Top Selling Cannabis Brands






Data for this report comes from real-time sales reporting by participating cannabis retailers via their point-of-sale systems, which are linked up with Headset’s business intelligence software. Headset’s data is very reliable, as it comes digitally direct from our partner retailers. However, the potential does exist for misreporting in the instance of duplicates, incorrectly classified products, inaccurate entry of products into point-of-sale systems, or even simple human error at the point of purchase. Thus, there is a slight margin of error to consider. Brands listed on this page are ranked in the top twenty within the market and product category by total retail sales volume.

