.svg)

Aug-2026
Sales
Trend
6-Month
Product Count
SKUs
Avg Price
YoY Sales Change
YoY Price Change


Where to Buy
Mello Farms is stocked at 68 licensed dispensaries across Massachusetts, with the deepest coverage in Marlborough, Quincy, Ayer, Chelsea, and Fall River. Search by ZIP code or city below to find the closest one, or filter by product type if you are after a specific format.
Market Insights Snapshot
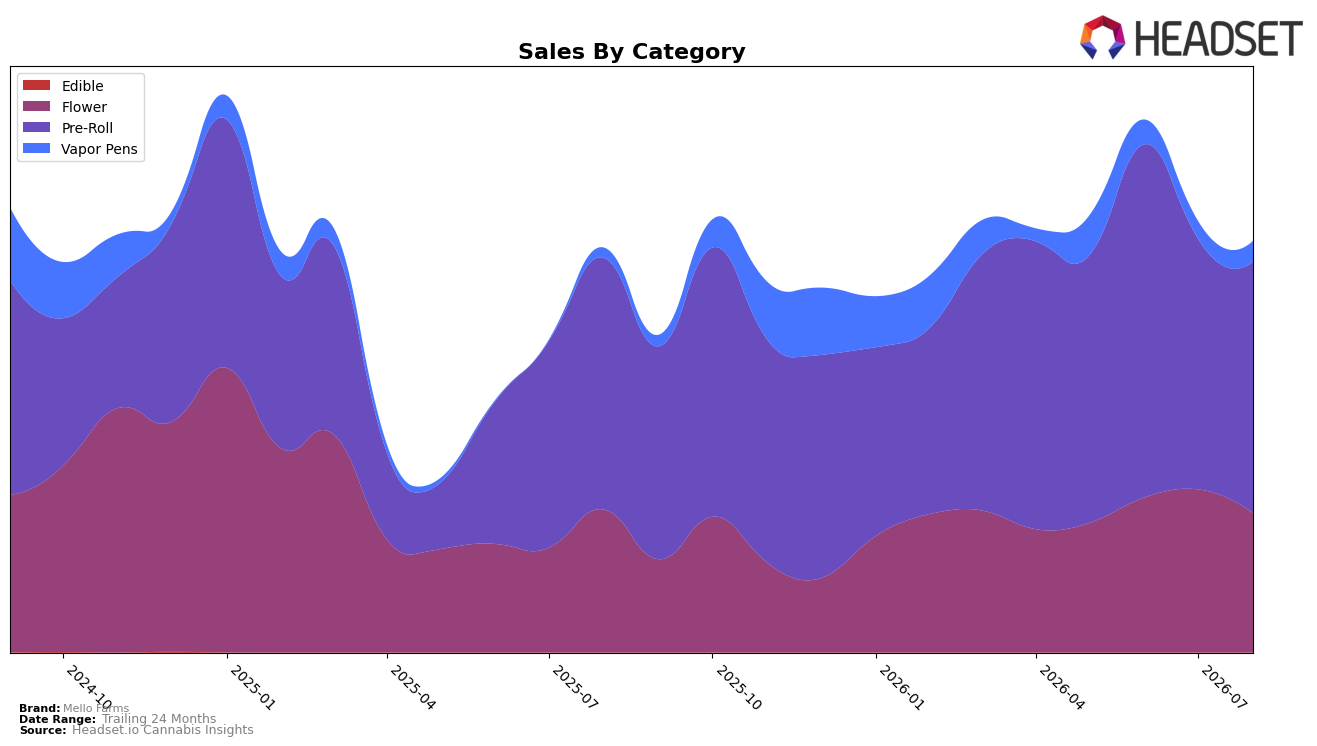
In August 2026, Mello Farms concentrated 61.16% of sales in Pre-Roll with month-over-month growth of 0.30% but year-over-year decline of 0.06%, while Flower held 33.83% share with a month-over-month drop of 14.63% and a year-over-year decline of 2.53%. Vapor Pens remained a small 5.00% share but expanded 17.30% month over month and 104.93% year over year, indicating a fast-growing tail that offsets pressure in Flower. With average price up 19.38% year over year to $11.05 and the top state Massachusetts, the mix suggests reliance on Pre-Roll despite a rank at 50 in Massachusetts Pre-Roll; the pattern implies category rebalancing is underway, with Vapor Pens uptake compensating for a Flower pullback.
The shift—Pre-Roll stability at 61.16% alongside a 14.63% month-over-month contraction in Flower and a 104.93% year-over-year surge in Vapor Pens—positions Mello Farms to lean into a two-tier strategy: defend Pre-Roll scale while accelerating into Vapor Pens where momentum is strongest. Given an overall brand sales lift of 1.67% year over year despite a 5.80% decline over 24 months, the combination of rising average price and a growing Vapor Pens slice implies margin and mix can improve if Pre-Roll share remains above 60% and Vapor Pens sustain double-digit monthly gains, while the 50 rank in Massachusetts Pre-Roll signals room to trade share from Flower to higher-velocity formats without sacrificing core visibility.
Competitive Landscape
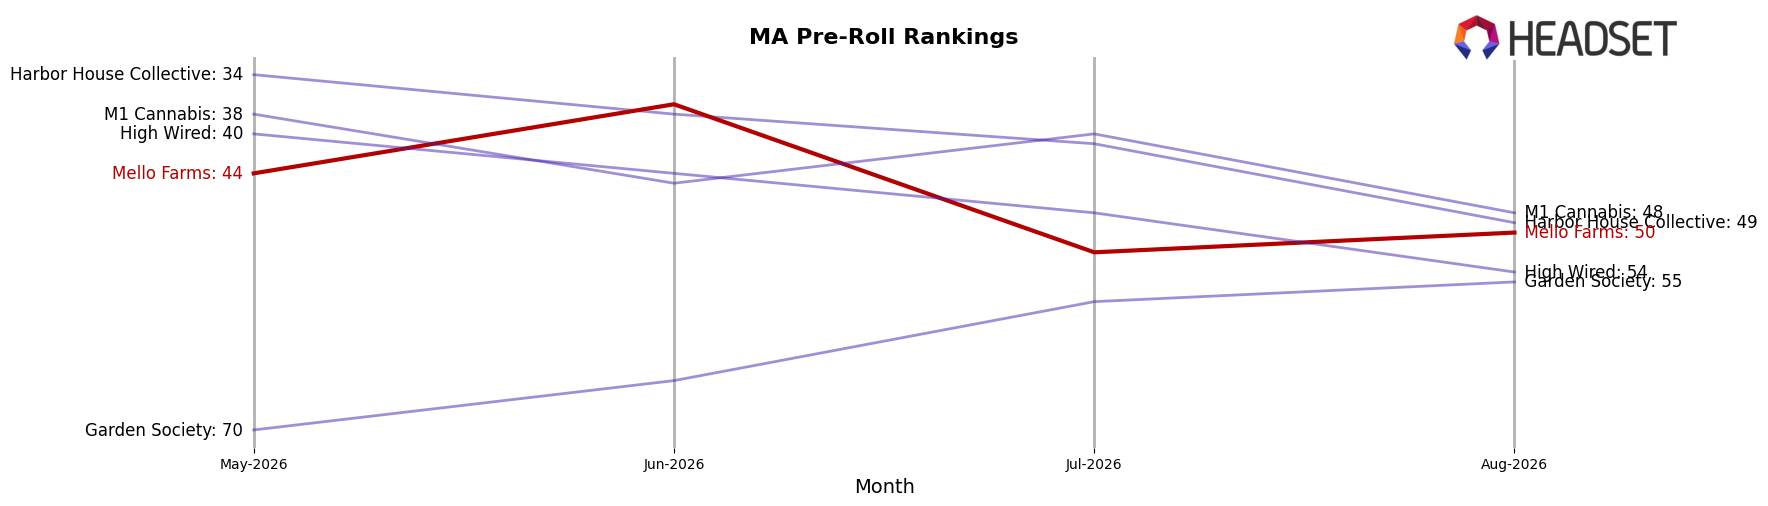
Mello Farms ranks at #50 in MA Pre-Roll in August 2026, slipping 1 position year over year from #49 while falling 6 spots from #44 since May–July trend, even after peaking at #37 in June 2026; meanwhile, Jeeter held #1 with a 7.0% YoY sales lift and Cali-Blaze advanced from #6 to #2 on 146.3% YoY growth, indicating that Mello Farms’ downward rank drift amid faster-rising leaders points to share erosion unless mix or distribution changes reverse the post–June 2026 slide.
Notable Products
Sheesh Pre-Roll (1g) posted the largest movement in August 2026 with a 321% month-over-month gain, climbing into rank 4 while Premium Space Candy Pre-Roll (1g) fell 61% to rank 5. Galaxy Glitter Pre-Roll (1g) held rank 1 on an 9% gain as Glitter Bomb Pre-Roll (1g) sank 41% at rank 2, and three SKUs in the top four shifted by more than 40% in opposing directions. With eight of the top ten being Pre-Roll SKUs, the assortment is concentrated in a single format, implying Mello Farms is leaning into pre-roll velocity over breadth as volatility reallocates share within the lineup.
Top Selling Cannabis Brands






Data for this report comes from real-time sales reporting by participating cannabis retailers via their point-of-sale systems, which are linked up with Headset’s business intelligence software. Headset’s data is very reliable, as it comes digitally direct from our partner retailers. However, the potential does exist for misreporting in the instance of duplicates, incorrectly classified products, inaccurate entry of products into point-of-sale systems, or even simple human error at the point of purchase. Thus, there is a slight margin of error to consider. Brands listed on this page are ranked in the top twenty within the market and product category by total retail sales volume.

