.svg)


Market Insights Snapshot
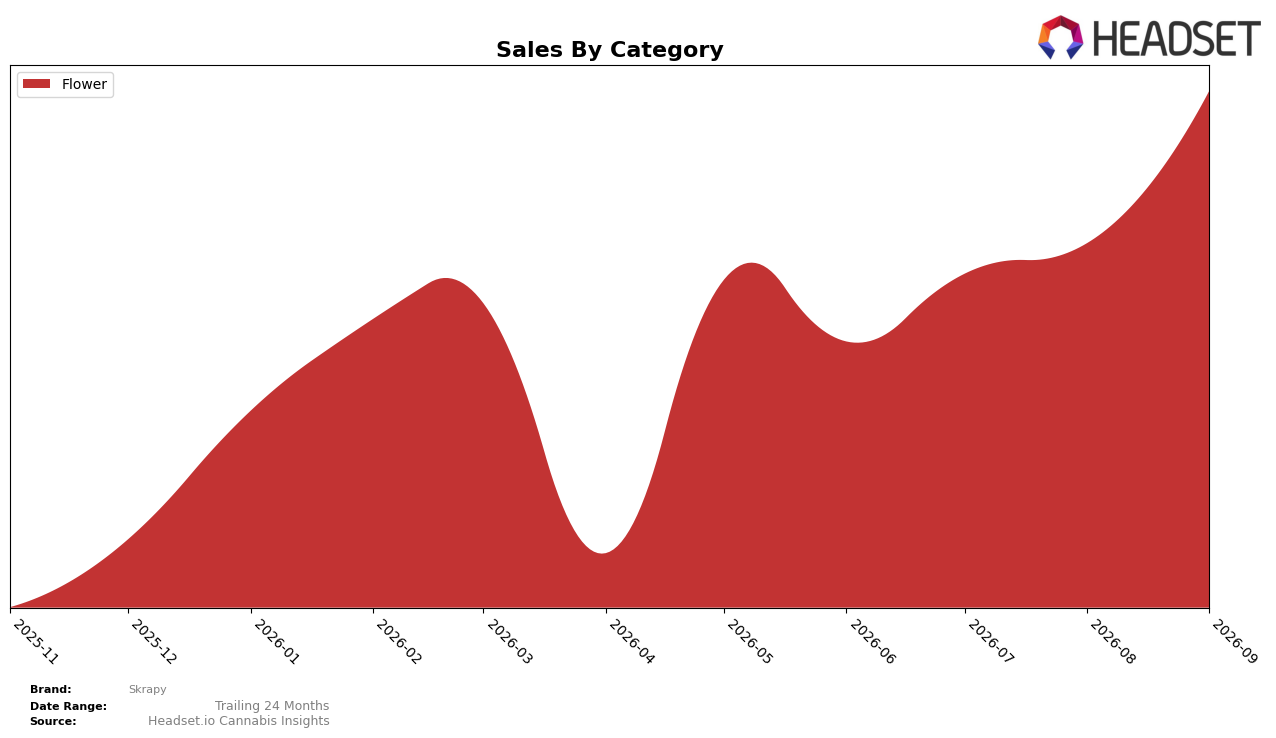
In September 2026, Skrapy’s category mix is fully concentrated in Flower at 100.0% share, with no other categories contributing, while month-over-month Flower sales expanded by 33.2% and the brand held rank 47 in Flower within Missouri. Average price sat at $74.35 alongside a 33.2% MoM sales lift and a 100.0% category share, which together imply that September 2026 growth came from deeper penetration or velocity within a single-category footprint rather than assortment expansion, positioning the brand to gain volume without diversification.
Because 100.0% of sales are in Flower and rank sits at 47 in Missouri despite a 33.2% MoM gain, Skrapy’s positioning leans toward a focused specialist rather than a portfolio balancer, suggesting sensitivity to Flower-specific demand cycles and headroom if rank efficiency improves. The combination of a $74.35 average price and a 33.2% MoM increase, while remaining at rank 47 in the Missouri Flower set, indicates that the brand’s near-term leverage is in price-pack architecture and velocity within Flower, implying that share gains will likely come from execution in this single lane rather than cross-category spillover.
Competitive Landscape
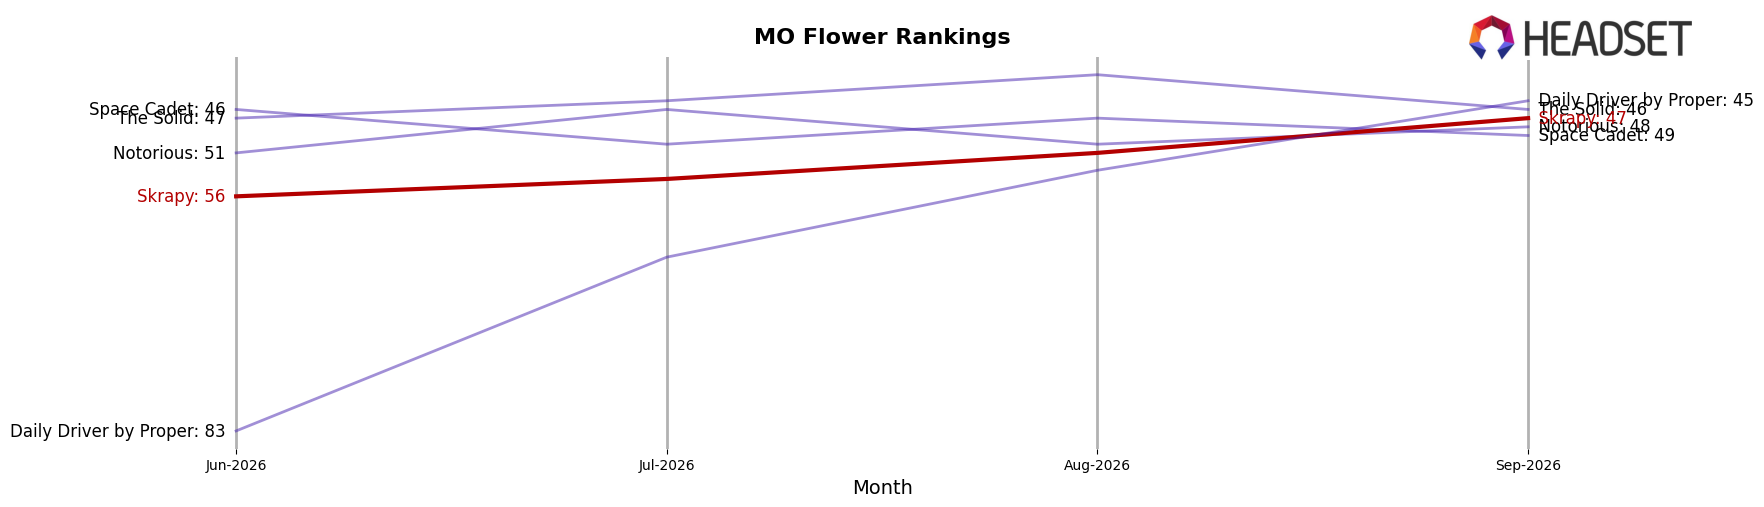
Skrapy sits at rank #47 in MO Flower in September 2026, with no year-over-year rank available, while improving 9 positions from #56 in June 2026 and hitting its peak rank of #47 in September 2026; in contrast, Flora Farms holds #1 with a 33.4% year-over-year sales increase and Amaze Cannabis climbed to #2 from #6 alongside a 19.8% sales lift. Meanwhile, Sinse Cannabis remains #3 with an 11.1% sales decline and Illicit / Illicit Gardens is #4 with an 8.7% drop, indicating that Skrapy’s recent 3-month ascent into the high-40s is occurring as mid-top peers diverge on momentum; the pattern implies Skrapy’s trajectory is upward off a low base, but material share gains will require closing the gap to leaders whose ranks are stable at #1–#2 and whose sales trends are expanding.
Notable Products
Grape Cream Cake Shake (28g) posted the largest month-over-month surge at +109.5% and climbed into rank 5, while Gary Satan Shake (28g) fell -68.8% yet still held rank 4; this divergence indicates volatility within mid-tier spots despite proximity in ranks. Cherry Burst Shake (28g) dropped -47.4% to rank 9 as Gelato 91 Reversal Shake (28g) rose +36.8% to rank 8, and five of the top ten sit at ranks 1–5, concentrating share in the Flower shake family; this clustering suggests assortment depth is driving rank density at the top more than individual SKU consistency. Velvet Diesel Shake (28g) and Mind Melt Shake (28g) occupied ranks 1 and 2 without reported MoM rates, while Lime OG Shake (28g) advanced +10.1% at a tied rank 5 and Pink Lime Beer Shake (28g) held rank 7 with $6,596 in sales; the pattern implies Skrapy is leaning into breadth of Flower shakes to buffer volatility from spike-and-dip SKUs.
Top Selling Cannabis Brands






Data for this report comes from real-time sales reporting by participating cannabis retailers via their point-of-sale systems, which are linked up with Headset’s business intelligence software. Headset’s data is very reliable, as it comes digitally direct from our partner retailers. However, the potential does exist for misreporting in the instance of duplicates, incorrectly classified products, inaccurate entry of products into point-of-sale systems, or even simple human error at the point of purchase. Thus, there is a slight margin of error to consider. Brands listed on this page are ranked in the top twenty within the market and product category by total retail sales volume.

