.svg)

Aug-2026
Sales
Trend
6-Month
Product Count
SKUs
Avg Price
YoY Sales Change
YoY Price Change


Where to Buy
Borealis is stocked at 33 licensed dispensaries across Missouri, Montana, and Connecticut, 28 of them in Missouri, with the deepest coverage in Kansas City, Columbia, Florissant, Saint Joseph, and St. Louis. Search by ZIP code or city below to find the closest one, or filter by product type if you are after a specific format.
Market Insights Snapshot
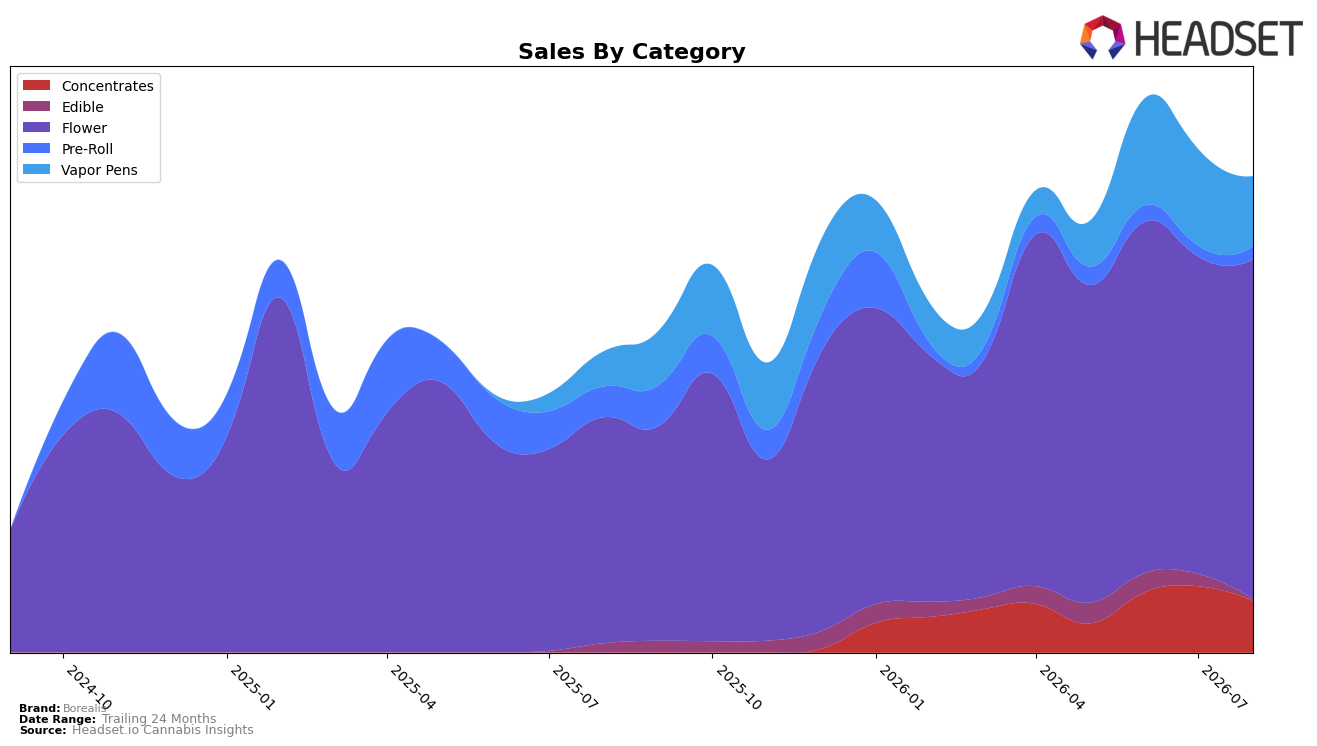
In August 2026, Borealis concentrated 71.45% of sales in Flower with 50.42% year-over-year growth and a 7.02% month-over-month lift, while Vapor Pens held 14.71% share with 99.53% year-over-year growth but a 27.54% month-over-month decline; this mix shift coexisted with a 19.82% year-over-year drop in average price to $26.70 and brand-level sales growth of 58.33% year over year. Pre-Roll was just 2.68% share with a 58.08% year-over-year decline and a 21.13% month-over-month rebound, and Concentrates at 10.86% share lacked a year-over-year baseline but fell 22.12% month over month; the upshot is that Flower is anchoring the brand’s growth as Pens and Concentrates retrench month over month, setting a reliance on a single category despite multi-category year-over-year gains.
With Flower ranking 44th in Missouri, the 7.02% month-over-month Flower uptick against a 27.54% month-over-month decline in Vapor Pens positions Borealis as a Flower-led value contender given its 19.82% year-over-year price compression. The combination of a 21.13% month-over-month Pre-Roll bounce and an 88.57% month-over-month Edible contraction, alongside a 22.12% month-over-month drop in Concentrates and a 99.53% year-over-year rise in Pens, indicates short-term execution is skewed toward Flower and opportunistic Pre-Roll recovery, implying near-term shelf strategy should prioritize Flower depth while stabilizing Pens to prevent overexposure to a single category rank position.
Competitive Landscape
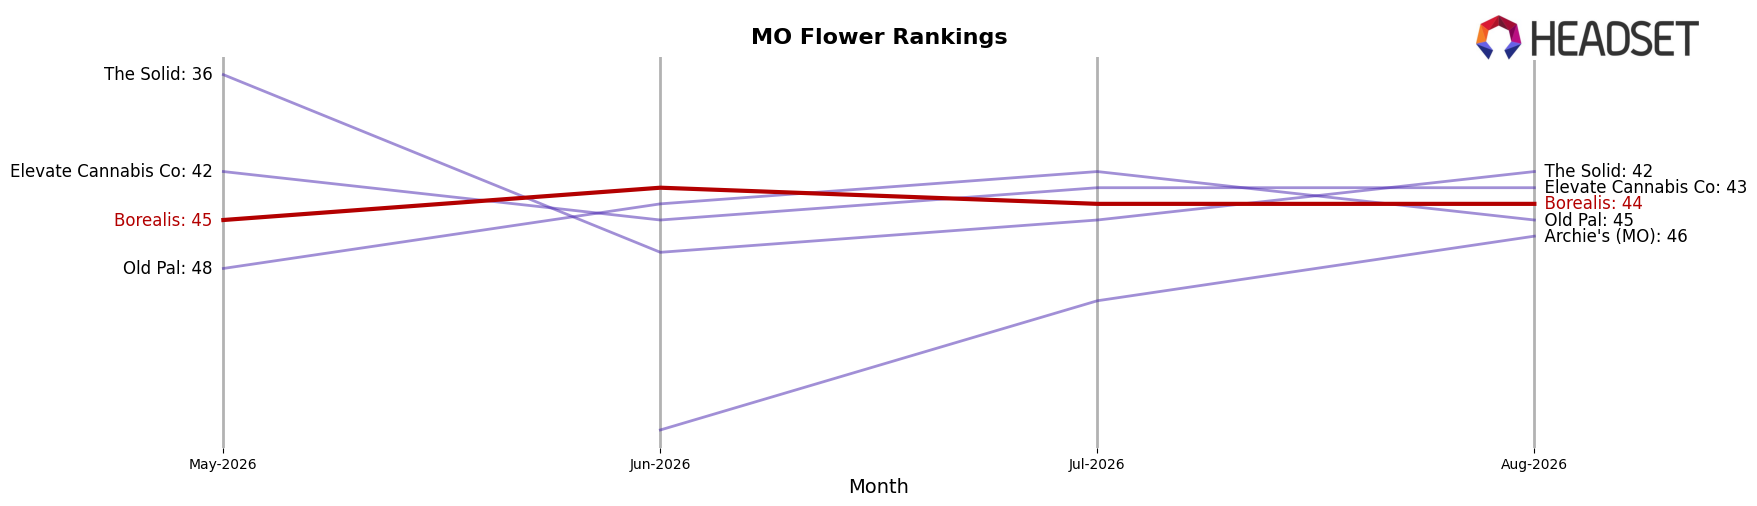
Borealis sits at #44 in MO Flower for August 2026, improving 7 positions from #51 year over year while slipping 1 place from #45 over the last three months; this sits below its peak of #36 from February 2025 and far behind Flora Farms holding #1 with a 2.7% YoY sales lift and Farmer G jumping from #31 to #5 on 434.6% YoY growth, indicating Borealis is gaining ground YoY but losing relative momentum versus faster-rising leaders, implying the current trajectory points to incremental rank recovery rather than a return to its February 2025 peak without a step-change in competitiveness.
Notable Products
Black Marshmallow #3 (7g) posted the standout move in August 2026 with a 111.2% month-over-month surge to $36,075 and climbed to rank 4, while Garlic Spuds (3.5g) also jumped 101.4% to rank 1. In contrast, Scotch & Soda (3.5g) fell 65.7% to rank 8 and Black Marshmallow #3 (3.5g) dropped 43.3% to rank 5, indicating a shift toward larger pack sizes and away from certain 3.5g formats. With Flower occupying nine of the top ten positions and Hash Burger (3.5g) sliding 16.6% to rank 2 even as Point Break (3.5g) rose 29.1% to rank 3, the concentration suggests reliance on a narrow category with volatility across sizes within shared strains. The pattern implies Borealis is migrating demand toward higher-weight Flower SKUs and select flagship 3.5g offerings, signaling a pack-size and strain-tier rebalancing that can be leveraged for margin and shelf space control.
Top Selling Cannabis Brands






Data for this report comes from real-time sales reporting by participating cannabis retailers via their point-of-sale systems, which are linked up with Headset’s business intelligence software. Headset’s data is very reliable, as it comes digitally direct from our partner retailers. However, the potential does exist for misreporting in the instance of duplicates, incorrectly classified products, inaccurate entry of products into point-of-sale systems, or even simple human error at the point of purchase. Thus, there is a slight margin of error to consider. Brands listed on this page are ranked in the top twenty within the market and product category by total retail sales volume.

