.svg)
Aug-2026
Sales
Trend
6-Month
Product Count
SKUs
Avg Price
YoY Sales Change
YoY Price Change


Market Insights Snapshot
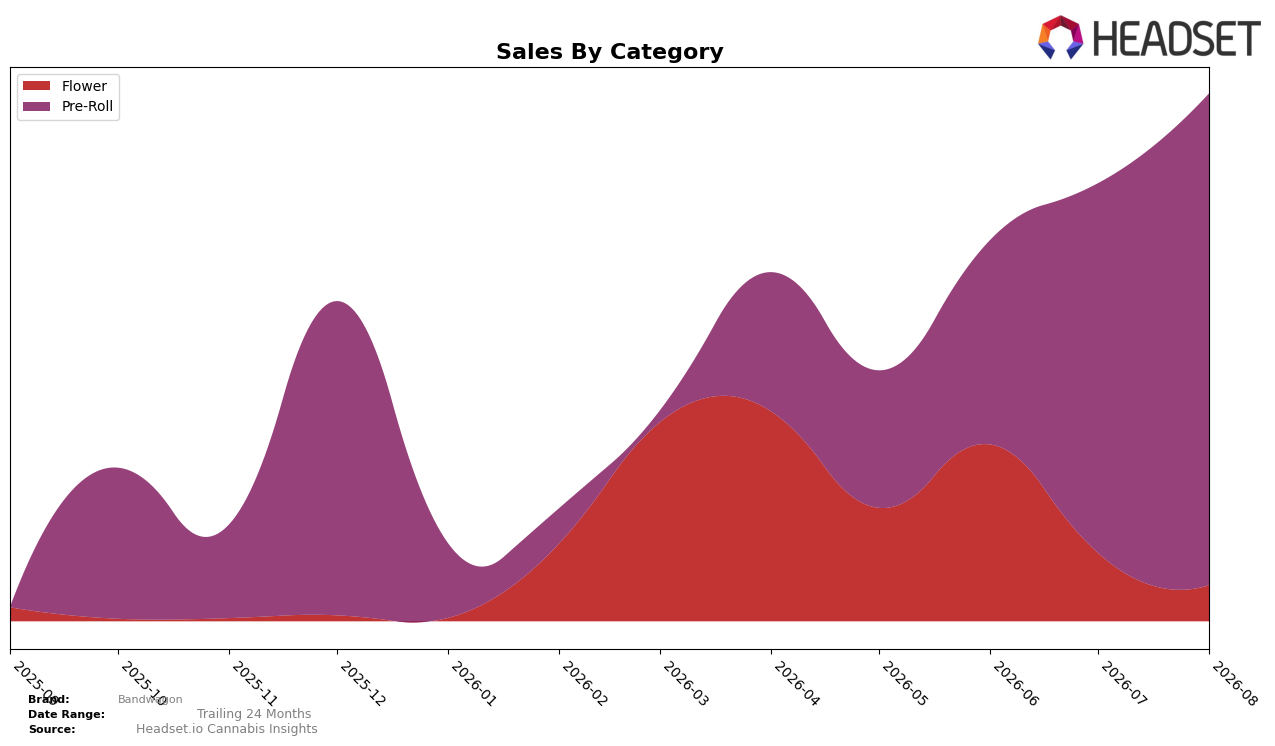
Bandwagon’s August 2026 mix is overwhelmingly concentrated in Pre-Roll at 93.24% share while Flower holds 6.76% share, indicating a skew that widened month over month as Pre-Roll grew 33.19% MoM and Flower fell 47.70% MoM. Average pricing diverged as well, with Pre-Roll at $12.88 versus Flower at $25.94, a gap that reinforces unit-led gains in the heavier-weighted format; combined, the two moves imply volume consolidation into lower-priced Pre-Rolls and an accelerated exit from higher-priced Flower. With Pre-Roll ranked 27 in Saskatchewan and the category’s 33.19% MoM growth outpacing the brand’s shrinking Flower presence by 80.89 percentage points, the pattern implies Bandwagon is trading depth in one lane for breadth across formats and risks overexposure if category momentum reverses.
The tilt toward Pre-Roll at 93.24% share alongside a 27th rank in Pre-Roll suggests a pricing-and-format play that favors incremental velocity over premium trade-up, given the $12.88 Pre-Roll price versus $25.94 in Flower and the 47.70% MoM Flower contraction. Because the MoM spread between Pre-Roll growth (+33.19%) and Flower decline (-47.70%) is 80.89 points, the brand’s positioning now hinges on sustaining repeat in a single category rather than balancing across segments, which could cap upside if assortment or shelf resets prioritize multi-format portfolios; the thesis is that Bandwagon’s current mix prioritizes short-cycle unit throughput and limits defense against competitive shifts in Saskatchewan.
Competitive Landscape
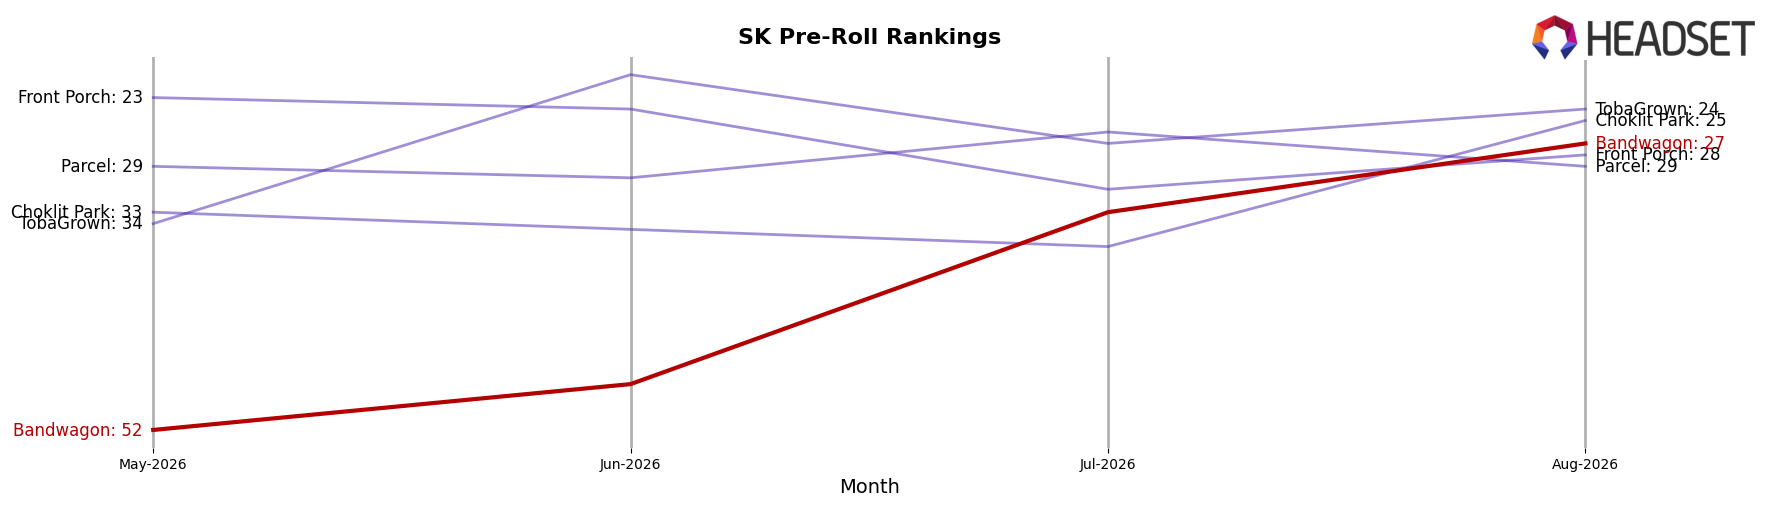
Bandwagon sits at rank #27 in SK Pre-Roll in August 2026, up 25 positions from #52 in May 2026, though year-over-year rank is unavailable; by contrast, Back Forty / Back 40 Cannabis holds #1 with a year-over-year move from #2 and +172.1% sales growth, while Spinach is at #5 after sliding from #1 with -21.4% sales, indicating Bandwagon’s rapid climb to a new peak rank (#27 in August 2026) is tied more to recent quarter-on-quarter share gains than to the broader year-over-year reshuffle at the top.
Notable Products
Blueberry Lemon Drop Pre-Roll 3-Pack (1.5g) posted the largest month-over-month surge at +668% to rank 2, while Patio SZN Pre-Roll 3-Pack (1.5g) plunged -92% to rank 8, indicating abrupt share reallocation within the lineup. SPF 30 Pre-Roll 3-Pack (1.5g) jumped +427% to rank 1 and Strawberry Cyclone Infused Pre-Roll 3-Pack (1.5g) climbed +240% at rank 6, and with eight of the top ten in the Pre-Roll family the category now concentrates Bandwagon’s volume and visibility. In contrast, Raspberry Colada Pre-Roll 3-Pack (1.5g) slipped -18% to rank 3 and Rhubarb Krisp Pre-Roll 3-Pack (1.5g) fell -83% to rank 9, pointing to flavor-level polarization rather than a category-wide issue. The pattern implies Bandwagon is pivoting toward a pre-roll-led play where a few fast-scaling SKUs capture demand while underperforming variants are likely candidates for pruning and reinvestment.
Top Selling Cannabis Brands






Data for this report comes from real-time sales reporting by participating cannabis retailers via their point-of-sale systems, which are linked up with Headset’s business intelligence software. Headset’s data is very reliable, as it comes digitally direct from our partner retailers. However, the potential does exist for misreporting in the instance of duplicates, incorrectly classified products, inaccurate entry of products into point-of-sale systems, or even simple human error at the point of purchase. Thus, there is a slight margin of error to consider. Brands listed on this page are ranked in the top twenty within the market and product category by total retail sales volume.

