.svg)
Jul-2026
Sales
Trend
6-Month
Product Count
SKUs
Avg Price
YoY Sales Change
YoY Price Change


Market Insights Snapshot
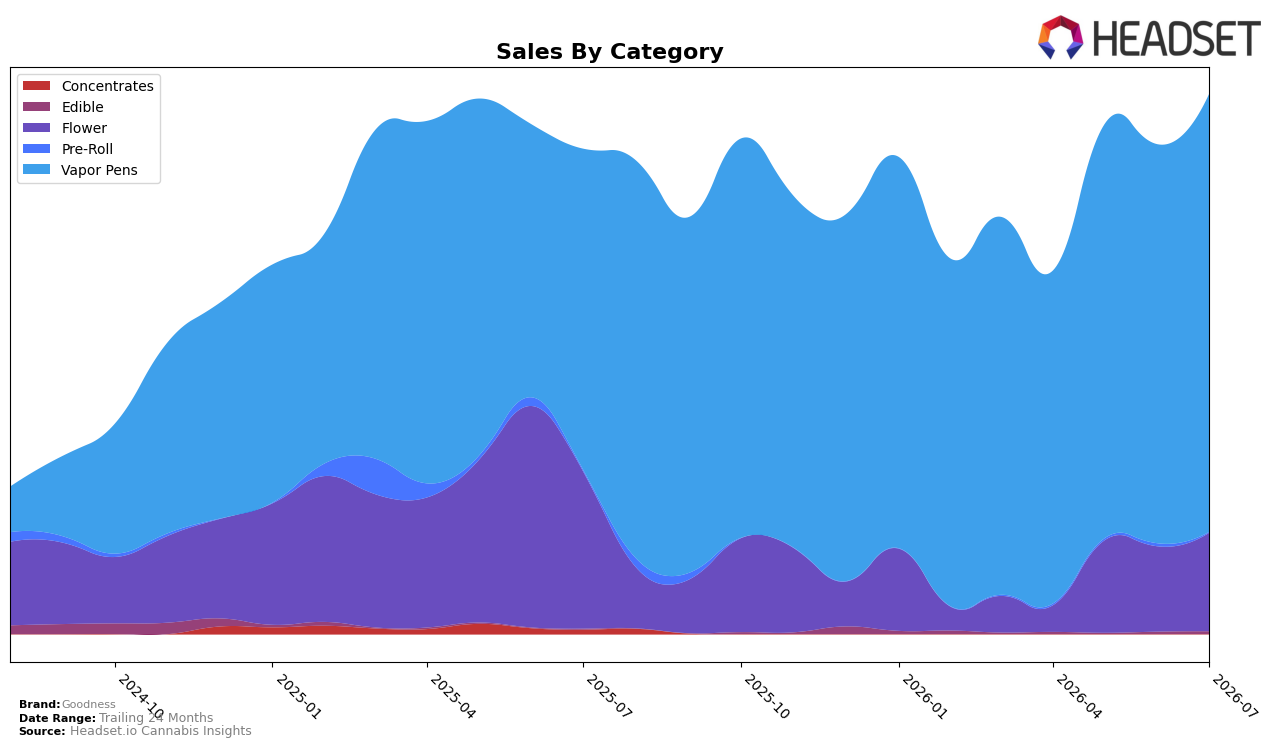
In July 2026, Vapor Pens held 81.25% share with year-over-year growth of 36.58% and month-over-month growth of 9.76%, while Flower sat at 18.20% share with a -37.65% year-over-year change and a 15.45% month-over-month increase. Edible contributed 0.46% share with a 293.42% year-over-year surge and an 18.55% month-over-month rise, whereas Pre-Roll fell to 0.09% share with -60.43% year-over-year and -80.82% month-over-month declines. With the brand ranked 46th in Vapor Pens in Massachusetts and an average price down 21.08% year over year to $16.67, the pattern implies that mix expansion is being driven by lower-priced Vapor Pens while Flower volume recovery is recent and shallow.
The concentration in Vapor Pens at 81.25% alongside a 36.58% year-over-year rise, contrasted with Flower’s -37.65% year-over-year drop and only 18.20% share, implies a positioning clustered around value-accessible inhalables rather than a balanced multi-format portfolio. The 293.42% year-over-year increase in Edible from a 0.46% share and the -80.82% month-over-month contraction in Pre-Roll from a 0.09% share indicate experimental, low-stakes extensions rather than scale bets; combined with a 9.76% month-over-month gain in Vapor Pens and a 15.45% month-over-month uptick in Flower, the thesis is that July 2026 momentum comes from price-led pen strength with tentative diversification that is unlikely to shift the center of gravity near term.
Competitive Landscape
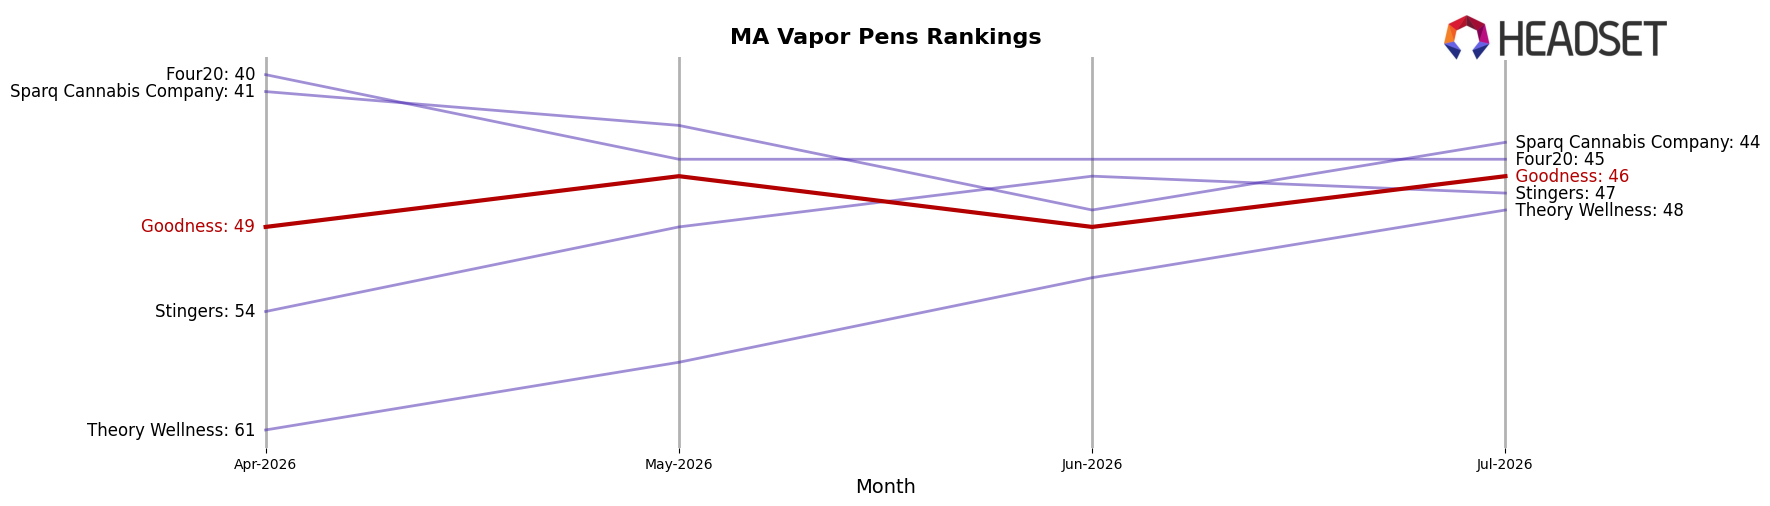
Goodness sits at rank #46 in July 2026, improving 6 positions from #52 year over year, but slipping 3 spots from #49 in April 2026 and 4 spots from its peak #42 in January 2026; against this, Dime Industries climbed from #6 to #4 while growing sales 74.3%, and category leader Fernway held #1 year over year with 83.0% sales growth, indicating Goodness’s modest rank recovery is outpaced by faster-moving leaders and that sustaining momentum will require gains beyond incremental position shifts.
Notable Products
Green Crack Distillate Cartridge (1g) is the headline mover in July 2026 with a 58.3% month-over-month rise that propelled it to rank 1, while Trainwreck Distillate Cartridge (1g) fell 33.8% to rank 9; this split suggests aggressive substitution within the line rather than category expansion. Purple Punch Distillate Cartridge (1g) slid 13.5% to rank 4 as Jack Herer Distillate Cartridge (1g) climbed 31.5% to rank 7, and six of the top ten held or gained ground by 20% or more even as two posted double-digit declines; with all top-ten SKUs in Vapor Pens and one SKU clearing $21,960, the mix points to a focus on fast-cycling, sativa-leaning cartridges over maintaining breadth across underperforming strains.
Top Selling Cannabis Brands






Data for this report comes from real-time sales reporting by participating cannabis retailers via their point-of-sale systems, which are linked up with Headset’s business intelligence software. Headset’s data is very reliable, as it comes digitally direct from our partner retailers. However, the potential does exist for misreporting in the instance of duplicates, incorrectly classified products, inaccurate entry of products into point-of-sale systems, or even simple human error at the point of purchase. Thus, there is a slight margin of error to consider. Brands listed on this page are ranked in the top twenty within the market and product category by total retail sales volume.

