.svg)

Aug-2026
Sales
Trend
6-Month
Product Count
SKUs
Avg Price
YoY Sales Change
YoY Price Change


Market Insights Snapshot
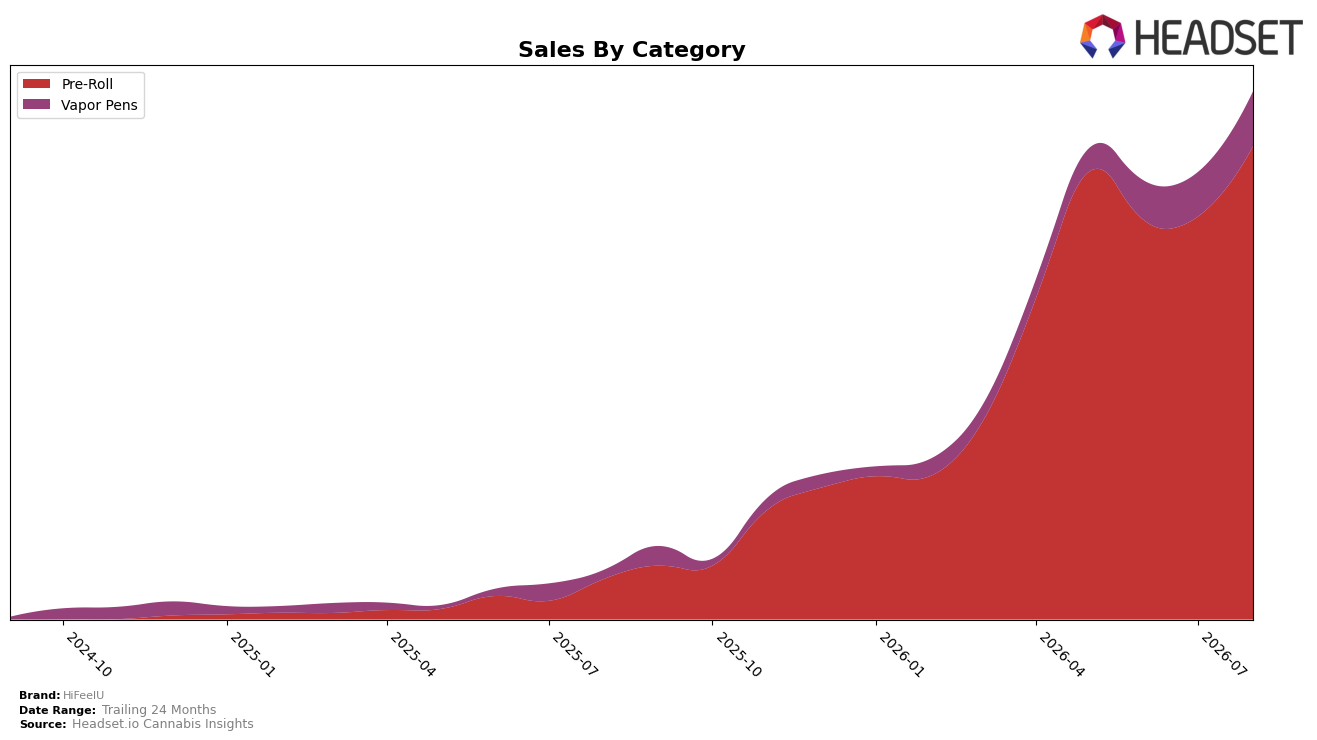
HiFeelU’s August 2026 mix concentrated 89.64% of sales in Pre-Roll, with Vapor Pens at 10.36%, while Pre-Roll grew 1,078.25% year over year and 17.45% month over month versus Vapor Pens at 524.03% YoY and 23.69% MoM. The average brand price fell 4.23% YoY to $23.23 as Pre-Roll’s lower $21.94 average pulled the blended price beneath Vapor Pens at $47.25, and the brand ranked 53 in Pre-Roll in Saskatchewan. The pattern implies a price-led, Pre-Roll-centric scale-up where accelerating MoM in Vapor Pens relative to Pre-Roll signals a secondary pillar forming without yet displacing the dominant Pre-Roll share.
The divergence—Pre-Roll’s 1,078.25% YoY vs. Vapor Pens’ 524.03% YoY, alongside a 17.45% MoM in Pre-Roll vs. 23.69% MoM in Vapor Pens—implies incremental trial is skewing toward Vapor Pens while repeat remains anchored in Pre-Roll. With 89.64% share concentrated in Pre-Roll and an average price 4.23% lower YoY, the brand is positioning around value access in Pre-Roll while using the higher-priced Vapor Pens at $47.25 to lift mix margin; this points to a barbell strategy where sustaining rank 53 in Saskatchewan depends on defending Pre-Roll velocity while nurturing faster MoM gains in Vapor Pens to reduce category concentration risk.
Competitive Landscape
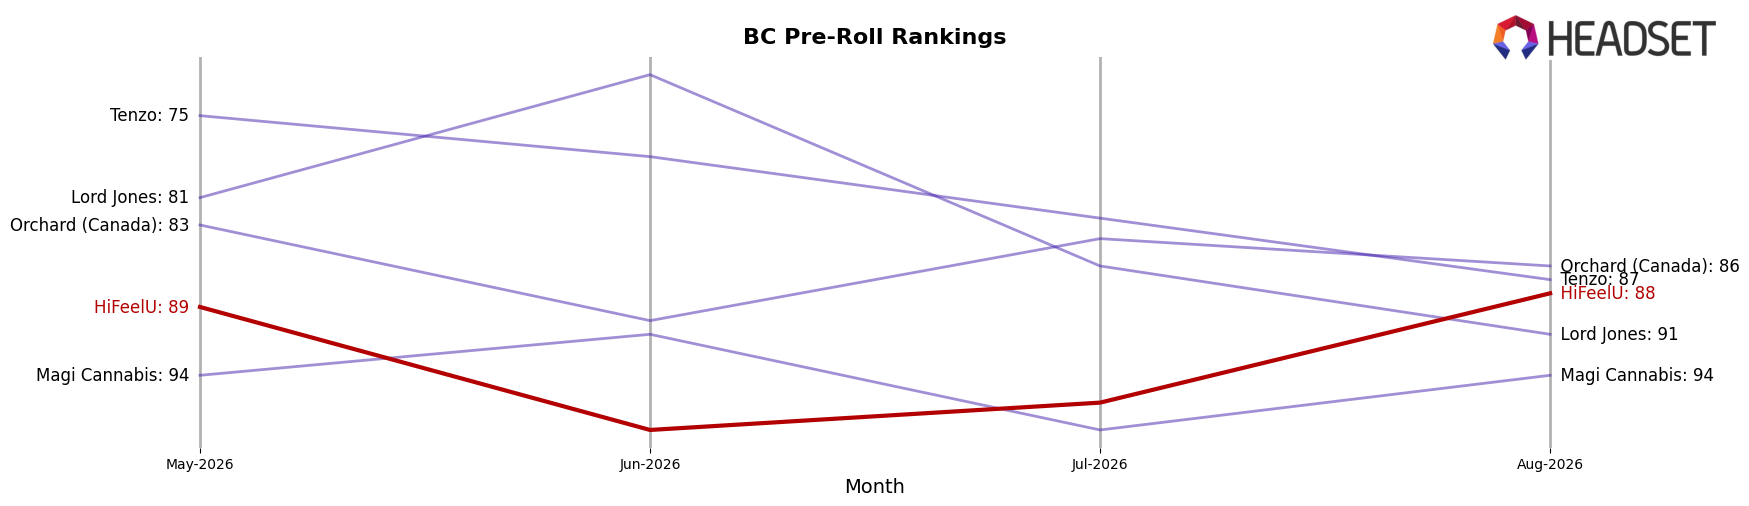
HiFeelU sits at rank #88 in BC Pre-Roll in August 2026, improving 60 places year over year from #148, while inching just 1 spot from #89 three months prior, indicating momentum concentrated in the past year but flattening quarter on quarter; by contrast, Back Forty / Back 40 Cannabis advanced from #17 to #1 with 237.7% YoY sales growth and General Admission slid from #1 to #2 with a -10.7% YoY decline, signaling that category share is consolidating at the top as volatility persists in lower tiers. With a peak rank matching current at #88 in August 2026 and only a 1-position change since May 2026, the pattern implies HiFeelU’s recovery from #148 is largely complete and future gains will require displacement rather than organic drift.
Notable Products
The Flow Pen Live Resin Disposable (1g) posted the largest move in August 2026 with +27.7% month over month and climbed to rank 3, while CBD Anytime Smooths Infused Kief Pre-Roll 10-Pack (3.5g) rose +27.2% to rank 2. Lite N' Smooth Pre-Roll 5-Pack (1.75g) held rank 1 with +15.6% MoM and accounted for $114,971, and Vapor Pens placed two SKUs in the top four alongside two Pre-Roll SKUs. This pattern implies the product mix is tilting toward higher-velocity inhalables, with disposable pens closing the gap on Pre-Rolls for near-term share capture.
Top Selling Cannabis Brands






Data for this report comes from real-time sales reporting by participating cannabis retailers via their point-of-sale systems, which are linked up with Headset’s business intelligence software. Headset’s data is very reliable, as it comes digitally direct from our partner retailers. However, the potential does exist for misreporting in the instance of duplicates, incorrectly classified products, inaccurate entry of products into point-of-sale systems, or even simple human error at the point of purchase. Thus, there is a slight margin of error to consider. Brands listed on this page are ranked in the top twenty within the market and product category by total retail sales volume.

