.svg)
Aug-2026
Sales
Trend
6-Month
Product Count
SKUs
Avg Price
YoY Sales Change
YoY Price Change


Where to Buy
NEON is stocked at 65 licensed dispensaries across Washington and New Mexico, 61 of them in Washington, with the deepest coverage in Tacoma, Everett, Seattle, Spokane, and Lacey. Search by ZIP code or city below to find the closest one, or filter by product type if you are after a specific format.
Market Insights Snapshot
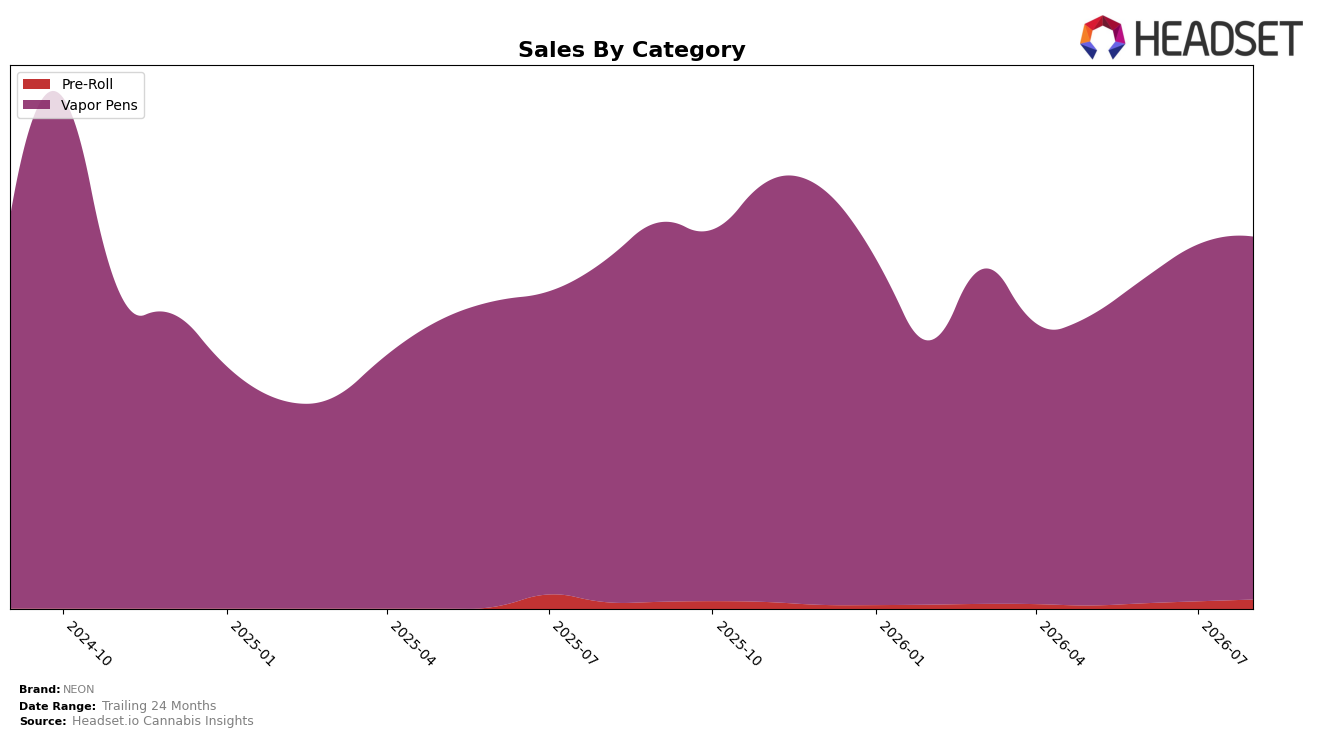
NEON’s August 2026 mix is overwhelmingly concentrated in Vapor Pens at 97.56% share, with Pre-Roll contributing 2.44%; within that, Vapor Pens grew 6.52% year over year and 1.69% month over month, while Pre-Roll expanded 36.70% YoY and 24.40% MoM. Despite overall brand sales up 7.10% YoY and average price down 6.77% YoY, the category concentration kept rank pressure visible in Washington where Vapor Pens stood at rank 43; the pattern implies NEON is sustaining its core with modest momentum while a small but accelerating Pre-Roll line is becoming a measurable growth lever.
The tilt toward Vapor Pens at 97.56% coupled with only 1.69% MoM growth versus 24.40% MoM in Pre-Roll suggests marginal share shifts could unlock outsized volume gains, especially with price elasticity already in play via a 6.77% YoY price decline. Holding rank 43 in Washington while brand sales rose 7.10% YoY and 24-month sales fell 4.32% implies the current positioning is plateauing in the core segment, and the accelerating Pre-Roll trajectory (36.70% YoY on 2.44% share) points to a practical path to diversify mix without diluting Vapor Pen scale.
Competitive Landscape
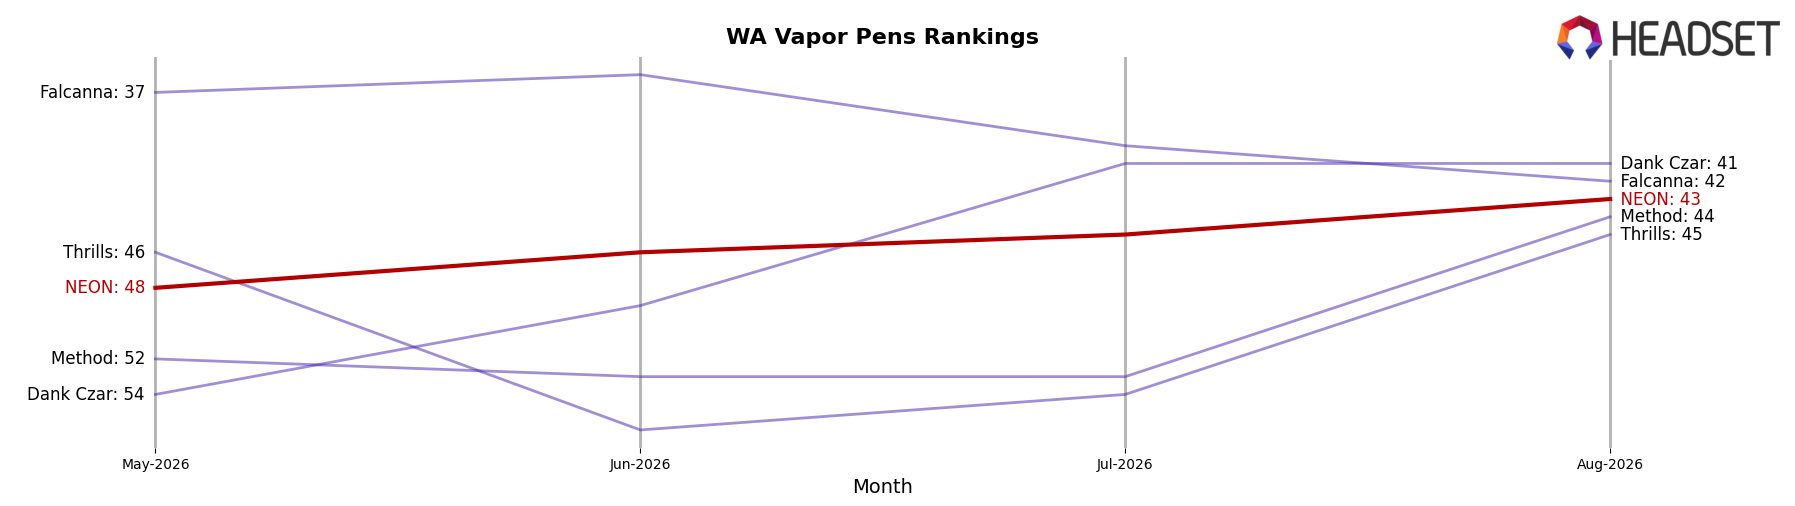
NEON holds rank #43 in Washington Vapor Pens in August 2026, improving 3 positions year over year from #46 and 5 positions since May 2026 from #48, while still trailing its peak at #35 from September 2025 by 8 spots; in contrast, Crystal Clear moved up from #3 to #1 and Mfused slipped from #1 to #2 alongside a 32.6% year-over-year sales decline, indicating that NEON’s modest rank climb is occurring amid reshuffling at the top and suggests a gradual recovery path rather than a breakout re-entry to the top 30.
Notable Products
Kiwi Strawberry Distillate Disposable (1g) posted the largest move in August 2026 with a 62.4% MoM jump to $10,182, while Peach Rings Distillate Disposable (1g) fell 22.8% and Blueberry Muffin Distillate Disposable (1g) slid 30.6%, indicating volatility concentrated in disposables. The top two ranks are held by Vapor Pens SKUs, with Kiwi Strawberry Distillate Cartridge (1g) at rank 1 on a 12.4% MoM lift and the surging Kiwi Strawberry Distillate Disposable (1g) at rank 2, while Grape Candy Distillate Cartridge (1g) dropped 18.3% and Pink Lemonade Distillate Cartridge (1g) declined 21.6%. With all top-10 SKUs in Vapor Pens and multiple disposables swinging more than 20% MoM, the mix implies NEON is shifting demand toward flavor-led disposable formats where wins can offset sharper declines in weaker SKUs.
Top Selling Cannabis Brands






Data for this report comes from real-time sales reporting by participating cannabis retailers via their point-of-sale systems, which are linked up with Headset’s business intelligence software. Headset’s data is very reliable, as it comes digitally direct from our partner retailers. However, the potential does exist for misreporting in the instance of duplicates, incorrectly classified products, inaccurate entry of products into point-of-sale systems, or even simple human error at the point of purchase. Thus, there is a slight margin of error to consider. Brands listed on this page are ranked in the top twenty within the market and product category by total retail sales volume.

