.svg)
Aug-2026
Sales
Trend
6-Month
Product Count
SKUs
Avg Price
YoY Sales Change
YoY Price Change


Where to Buy
Parks & Recreation is stocked at 41 licensed dispensaries across Washington, with the deepest coverage in Seattle, Spokane, Des Moines, Everett, and Lacey. Search by ZIP code or city below to find the closest one, or filter by product type if you are after a specific format.
Market Insights Snapshot
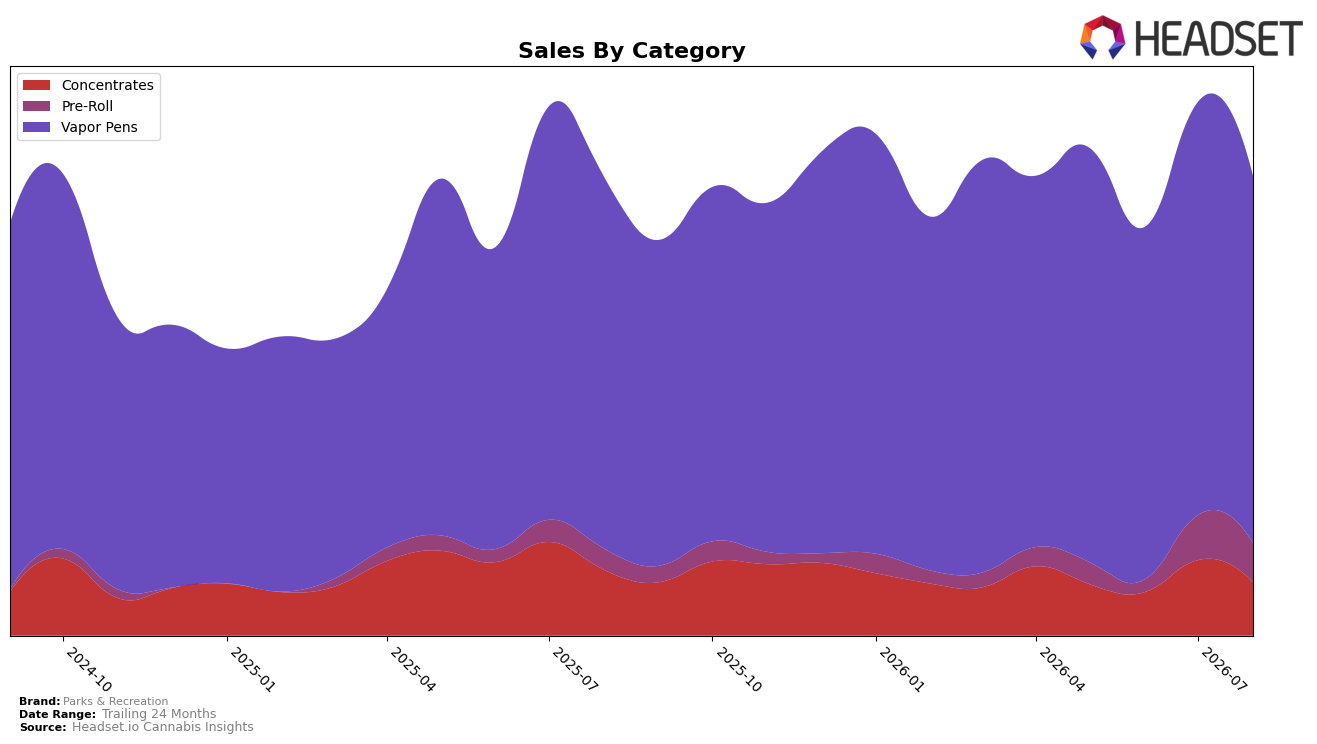
In August 2026, Parks & Recreation concentrated 73.88% of sales in Vapor Pens, yet that anchor category fell 1.15% YoY and 10.55% MoM, while Concentrates at 14.39% share declined 14.38% YoY and 22.78% MoM. The outlier was Pre-Roll at 11.73% share, which rose 40.60% YoY despite an 8.62% MoM dip, and carried the brand’s highest average price at $20.23 versus $12.36 in Vapor Pens. With overall brand sales up 10.89% YoY and average price up 2.01% YoY, the mix shift toward a faster-growing, higher-priced Pre-Roll pocket amid broad MoM contraction implies the brand’s near-term growth is being pulled by a small, premium-leaning segment while its core Vapor Pens base softens.
Parks & Recreation’s 49 rank in Vapor Pens in Washington alongside a 10.55% MoM slide in that category signals limited competitive pull where the brand holds most of its share, while a 40.60% YoY surge in Pre-Roll indicates headroom to reposition toward formats that price above the brand’s $12.34 average. The simultaneous 22.78% MoM decline in Concentrates and 8.62% MoM decline in Pre-Roll suggest short-term volatility, but the YoY divergence — down 14.38% in Concentrates versus up 40.60% in Pre-Roll — points to a strategy of reallocating attention toward Pre-Roll to offset Vapor Pens rank pressure and stabilize growth against category concentration risk.
Competitive Landscape
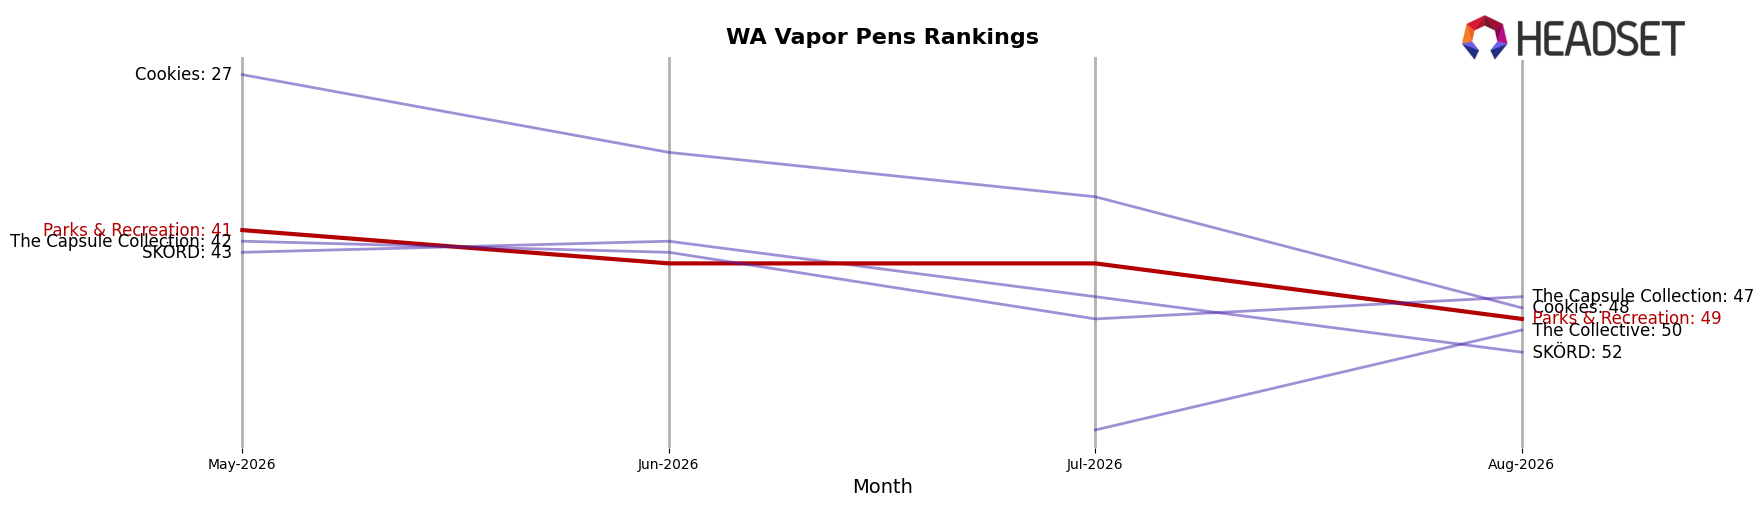
Parks & Recreation sits at rank #49 in WA Vapor Pens for August 2026, down 4 positions year over year from #45 and 8 spots below its three-month mark at #41; the brand is also 10 places off its category peak at #39 from January 2026, indicating sustained slippage rather than a short-term dip. In contrast, Crystal Clear climbed from #3 to #1 while growing sales by 19.4%, and Mfused fell from #1 to #2 alongside a 32.6% sales decline, suggesting top-tier volatility that Parks & Recreation has not capitalized on; meanwhile, Plaid Jacket moved from #6 to #3 with a 15.5% increase, reinforcing a tightening top five as Parks & Recreation drifts lower. The rank trajectory implies that without a near-term shift in assortment or pricing, Parks & Recreation is likely to continue ceding shelf visibility to competitors consolidating share at the top.
Notable Products
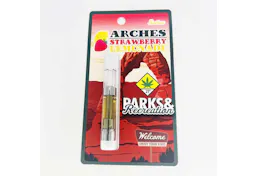
Olympic Blue Raspberry Distillate Cartridge (1g) posted the steepest move in August 2026 with a -40.1% month-over-month drop and slid to rank 8, while Mt St Helens Huckleberry Distillate Cartridge (1g) fell -22.4% despite holding a share of rank 1 alongside another SKU. Blue Raspberry Distillate Cartridge (1g) moved up with +15.1% MoM at rank 3, but Huckleberry Distillate Cartridge (1g) declined -13.3% at rank 2, indicating volatility concentrated among the brand’s core flavors. With all top-10 items in Vapor Pens and two SKUs tied at rank 1, the mix suggests Parks & Recreation is leaning deeper into a flavor-driven cartridge portfolio where rank consolidation at the top coexists with sharp tail-risk declines.
Top Selling Cannabis Brands






Data for this report comes from real-time sales reporting by participating cannabis retailers via their point-of-sale systems, which are linked up with Headset’s business intelligence software. Headset’s data is very reliable, as it comes digitally direct from our partner retailers. However, the potential does exist for misreporting in the instance of duplicates, incorrectly classified products, inaccurate entry of products into point-of-sale systems, or even simple human error at the point of purchase. Thus, there is a slight margin of error to consider. Brands listed on this page are ranked in the top twenty within the market and product category by total retail sales volume.

