.svg)
Aug-2026
Sales
Trend
6-Month
Product Count
SKUs
Avg Price
YoY Sales Change
YoY Price Change


Where to Buy
The Collective is stocked at 119 licensed dispensaries across Washington, Arkansas, and Nevada, 108 of them in Washington, with the deepest coverage in Seattle, Everett, Spokane, Tacoma, and Vancouver. Search by ZIP code or city below to find the closest one, or filter by product type if you are after a specific format.
Market Insights Snapshot
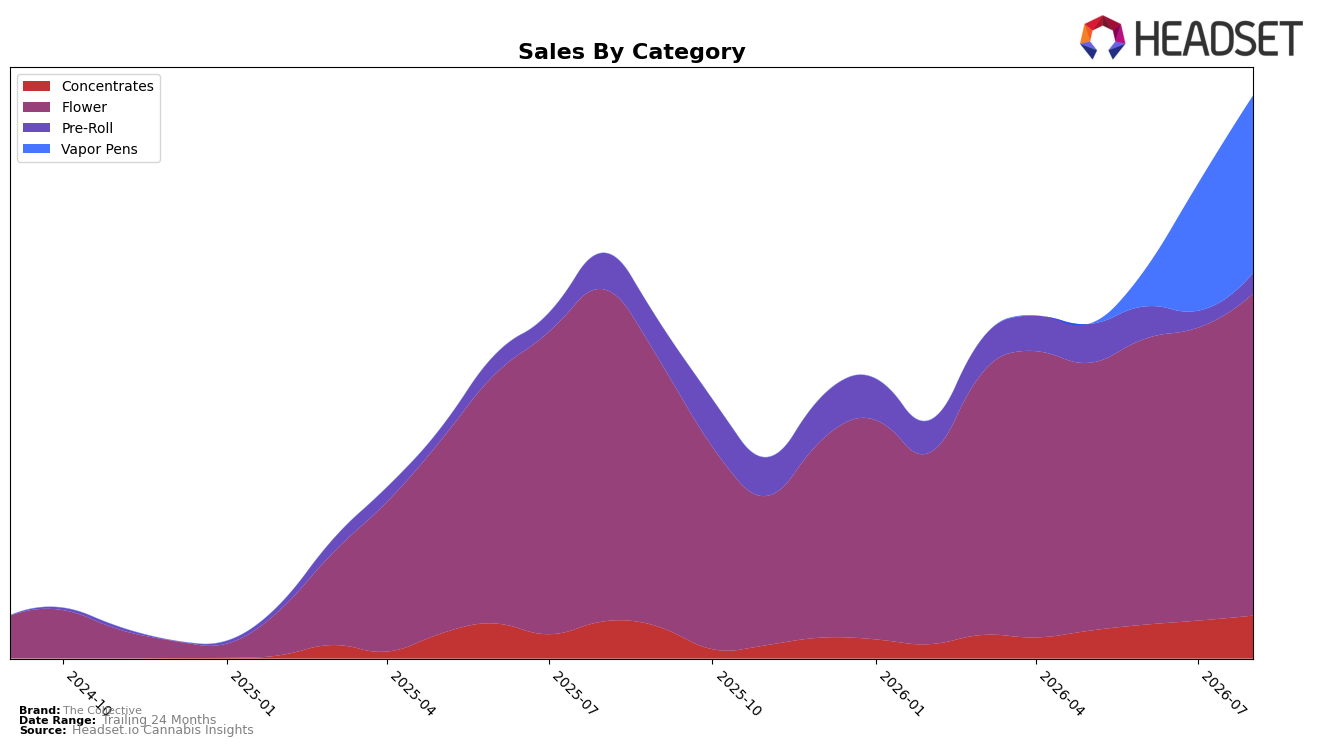
In August 2026, The Collective’s mix tilted toward Flower at 57.21% share with a month-over-month gain of 9.89% but a year-over-year decline of 3.05%, while Vapor Pens expanded to 31.54% share on a 39.82% month-over-month surge and no year-over-year read, indicating recent momentum concentrated in inhalables. Concentrates held 7.59% share with 13.23% month-over-month growth and a 15.54% year-over-year increase, whereas Pre-Roll slipped to 3.66% share after a 43.16% year-over-year drop despite a 23.21% month-over-month rebound; the category-level push-pull implies The Collective is reallocating demand from Pre-Roll toward higher-ticket inhalables as average price rose 6.83% year over year and the brand ranked 33 in Flower in Washington.
The pattern suggests The Collective’s positioning is shifting from breadth to depth within inhalables: the 31.54% Vapor Pens share coupled with a 39.82% month-over-month climb concentrates recent gains, while Flower’s 57.21% share and 9.89% month-over-month uptick sustain the base even as a 3.05% year-over-year decline flags competitive pressure at rank 33 in Washington. With Concentrates advancing 15.54% year over year and 13.23% month over month versus Pre-Roll’s 43.16% year-over-year contraction and only a 3.66% share, the mix indicates an intentional move toward potency-led formats that can support a higher realized price point of $13.28, implying near-term growth will rely on reinforcing Flower and Vapor Pens while treating Pre-Roll as a tactical, not strategic, volume lever.
Competitive Landscape
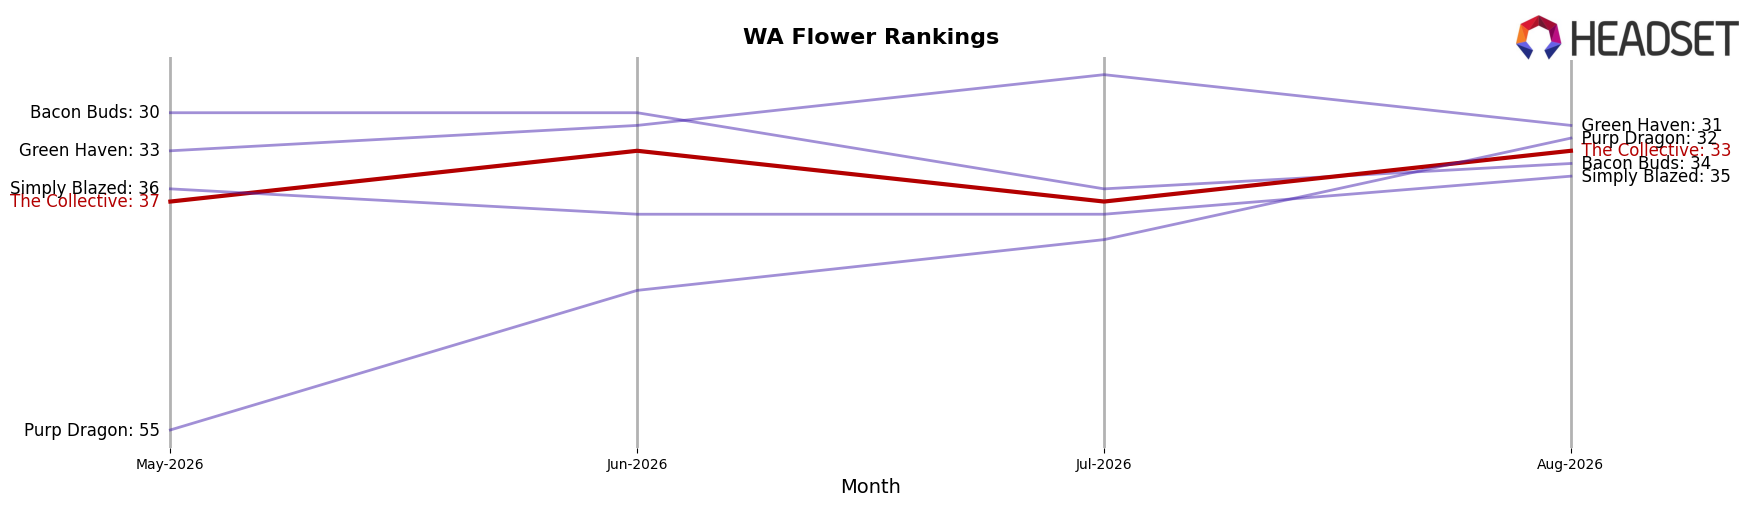
The Collective is ranked #33 in Washington Flower in August 2026, slipping 1 position year over year from #32 and improving 4 spots versus three months ago from #37, while its peak rank of #32 in August 2025 indicates a 1-place decline from last year’s best. Against leaders, Phat Panda holds #1 with a 23.7% YoY sales increase, and Lifted Cannabis Co moved up from #8 to #4 alongside a 10.8% YoY gain, whereas EZ Flower / EZ Puff / EZ-Joint fell from #3 to #5 with a -17.7% YoY slide; this mix of upward and downward moves at the top suggests The Collective’s slight YoY rank dip and recent quarter rebound position it as a mid-tier player that must convert short-term momentum into sustained rank recovery.
Notable Products
Blue Dream Distillate Cartridge (1g) posted the standout movement in August 2026 with a 116.7% month-over-month increase to rank 3, while White Russian (7g) fell 12.4% to rank 10; this divergence indicates spend is rotating from Flower into inhalable extracts. OG Kush Distillate Disposable (1g) also surged 69.3% at rank 6, and Blue Dream Distillate Disposable (1g) gained 24.4% at rank 2, with six of the top ten coming from Vapor Pens, signaling category concentration toward distillate formats over legacy Flower and Pre-Rolls. White Cherry Gelato Pre-Roll (1g) held rank 1 despite no prior-month baseline and Pineapple Chunk Pre-Roll (1g) sat at rank 8 with no MoM data, while Flower’s only top-ten entry is down even as Vapor Pens at ranks 2, 3, 4, 5, 6, 7, and 9 collectively climbed 24.4% to 116.7%. The pattern implies The Collective’s commercial direction is consolidating around Vapor Pens, prioritizing fast-moving distillate SKUs over declining Flower to capture momentum in inhalable convenience.
Top Selling Cannabis Brands






Data for this report comes from real-time sales reporting by participating cannabis retailers via their point-of-sale systems, which are linked up with Headset’s business intelligence software. Headset’s data is very reliable, as it comes digitally direct from our partner retailers. However, the potential does exist for misreporting in the instance of duplicates, incorrectly classified products, inaccurate entry of products into point-of-sale systems, or even simple human error at the point of purchase. Thus, there is a slight margin of error to consider. Brands listed on this page are ranked in the top twenty within the market and product category by total retail sales volume.

