.svg)

Aug-2026
Sales
Trend
6-Month
Product Count
SKUs
Avg Price
YoY Sales Change
YoY Price Change


Where to Buy
Neqtar is stocked at 24 licensed dispensaries across Washington, with the deepest coverage in Tacoma, Everett, Seattle, Snohomish, and Bremerton. Search by ZIP code or city below to find the closest one, or filter by product type if you are after a specific format.
Market Insights Snapshot
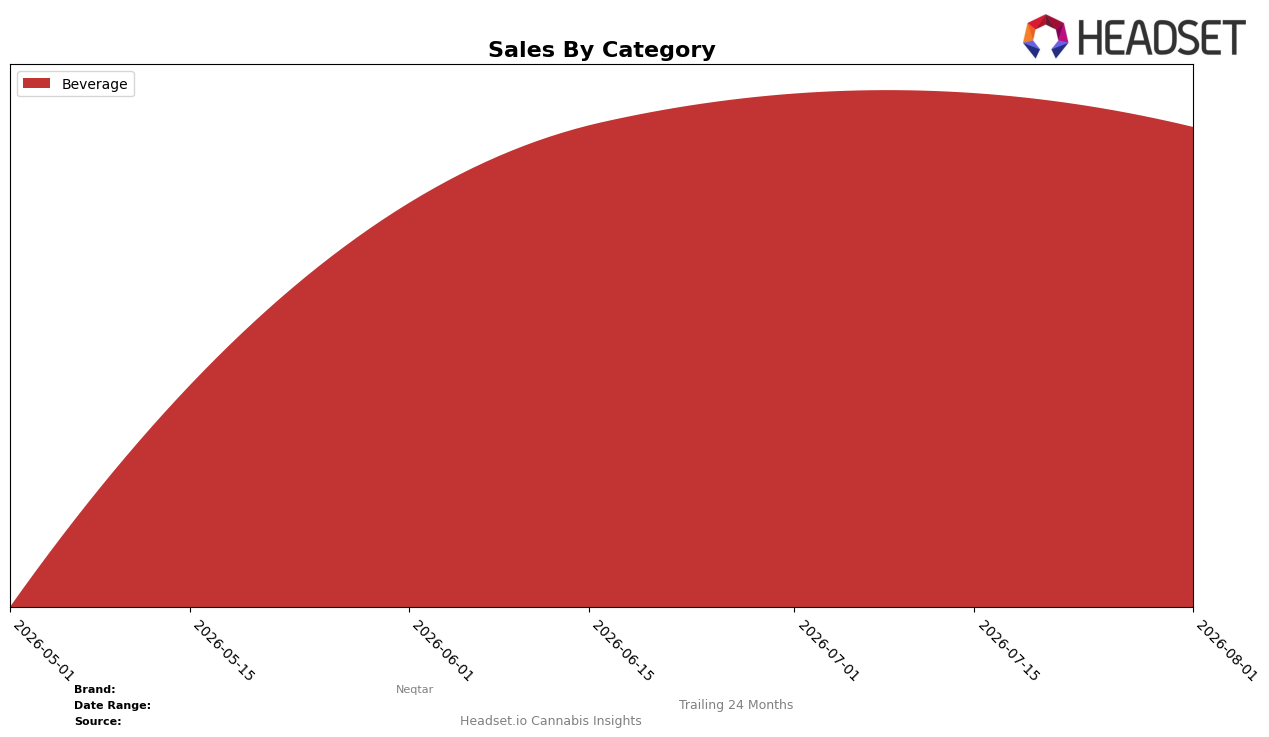
In August 2026, Neqtar operated as a single-category brand with Beverage at 100.0% of sales share and an average price of $4.95, indicating full concentration with no cross-category diversification. Within Beverage, month-over-month sales declined by 4.55% while share held at 100.0%, and the category rank in Washington was 13, placing the brand outside the top 10 despite full mix concentration. The pattern implies that a pure-play Beverage focus is not insulating Neqtar from month-level volatility, and the rank of 13 suggests the current price-volume balance is yielding mid-tier placement rather than top-decile performance.
The 4.55% month-over-month decline alongside a 100.0% category share and a rank of 13 in Washington signals a positioning where Neqtar is trading depth for breadth, with Beverage reliance limiting buffer against intra-category shifts. With an average price of $4.95 and a stable single-category mix at 100.0%, the implication is that incremental gains will likely come from either price architecture or sub-segment targeting within Beverage to convert share stability into rank improvement of at least 3 positions, rather than from mix expansion in the near term.
Competitive Landscape
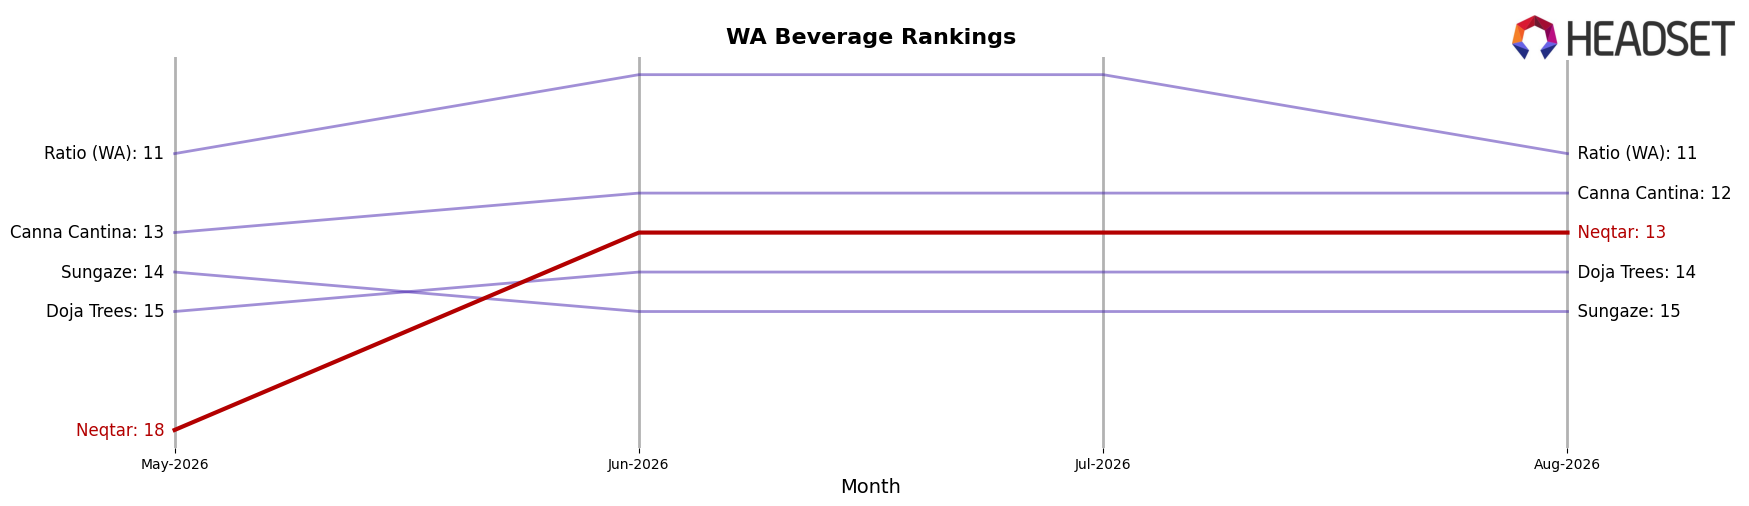
Neqtar is ranked #13 in WA Beverage in August 2026, up 5 positions from #18 in May 2026, and matching its peak rank of #13 in August 2026; while year-over-year rank is unavailable, the move from #18 to #13 across three months indicates a 5-rank climb relative to late spring. In the competitive set, Journeyman holds #1 after rising from #2 year over year and Ray's Lemonade sits at #2 after slipping from #1, whereas Blaze Soda surged to #4 from #9 with 123.8% year-over-year sales growth, implying that Neqtar’s ascent into the low teens must continue at a faster rate to avoid being boxed out by faster-moving rivals. The pattern implies Neqtar’s short-term rank momentum is positive but still fragile given top-tier churn and outsized competitor gains, so sustaining mid-single-digit rank improvements per quarter is necessary to convert this peak into durable share.
Notable Products
Fruit Punch Shot (100mg THC, 74ml, 2.5oz) posted the steepest decline at -26.34% and slid to rank 6, while Strawberry Lemonade Shot (100mg THC, 74ml, 2.5oz) fell -10.72% yet held rank 1, indicating price-sensitive tail risk at the lower end even as the flagship retains placement. CBN/CBD/THC 1:1:1 Blackberry Shot (100mg CBN, 100mg CBD, 100mg THC, 74ml, 2.5oz) dropped -11.76% at rank 4, whereas CBG/CBD/THC 1:1:1 Mango Shot (100mg CBG, 100mg CBD, 100mg THC, 74ml, 2.5oz) rose +16.53% to rank 2, signaling a consumer pivot toward CBG-forward formulations over CBN blends in August 2026. Six of the top ten are Beverage shots, with Raspberry Shot (100mg THC, 74ml, 2.5oz) at rank 3 and -8.36%, consolidating a concentrated format strategy even as flavor-level volatility widens. The mix implies Neqtar is leaning into functional, cannabinoid-complex shots where upside resides in CBG-led SKUs, while phasing or re-pricing underperforming THC-only flavors could protect margin concentration around the top three ranks and a unit revenue near $14,850 for the CBG/CBD/THC 1:1:1 Mango Shot.
Top Selling Cannabis Brands






Data for this report comes from real-time sales reporting by participating cannabis retailers via their point-of-sale systems, which are linked up with Headset’s business intelligence software. Headset’s data is very reliable, as it comes digitally direct from our partner retailers. However, the potential does exist for misreporting in the instance of duplicates, incorrectly classified products, inaccurate entry of products into point-of-sale systems, or even simple human error at the point of purchase. Thus, there is a slight margin of error to consider. Brands listed on this page are ranked in the top twenty within the market and product category by total retail sales volume.

