.svg)


Where to Buy
Pacific NW Farms is stocked at 56 licensed dispensaries across Oregon, with the deepest coverage in Portland, Eugene, Salem, Bend, and Corvallis. Search by ZIP code or city below to find the closest one, or filter by product type if you are after a specific format.
Market Insights Snapshot
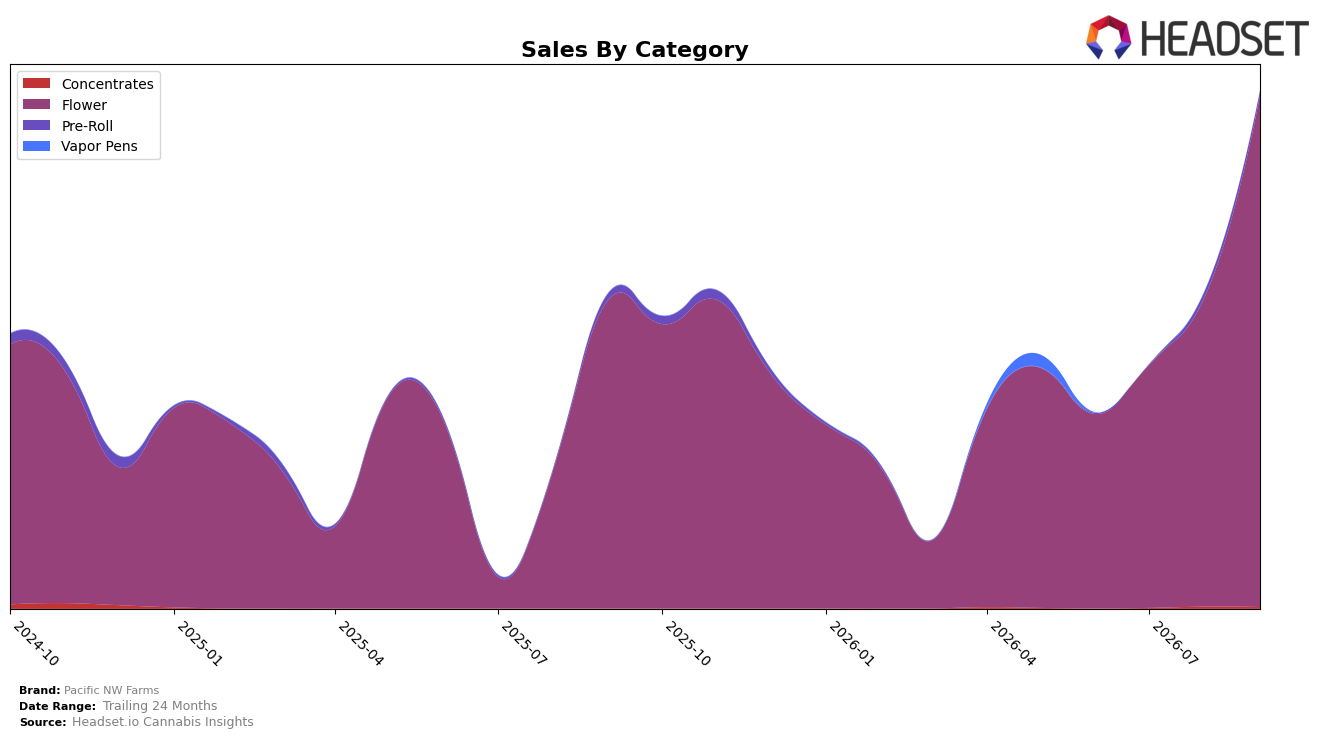
Pacific NW Farms concentrated 98.93% of September 2026 sales in Flower, up alongside category-level gains of 65.94% year over year and 65.27% month over month, while the overall brand rose 64.35% YoY and cut average price by 67.27%. Pre-Roll slipped to 0.81% share with a 33.92% YoY decline and a 22.86% MoM drop, and Concentrates held 0.26% share with a 22.50% MoM decline and no YoY comp, indicating a portfolio anchored in a single growth engine rather than diversified traction.
The 42 rank in Flower in Oregon, coupled with a 65.27% MoM Flower lift but a 22.86% MoM Pre-Roll decline, implies a price-led volume push concentrated in one aisle rather than a cross-category halo. With 98.93% share in Flower and only 1.07% combined in Pre-Roll and Concentrates, the brand is positioned as a Flower specialist whose September 2026 gains are sensitive to continued discounting and shelf space in a single category, rather than breadth-driven insulation.
Competitive Landscape
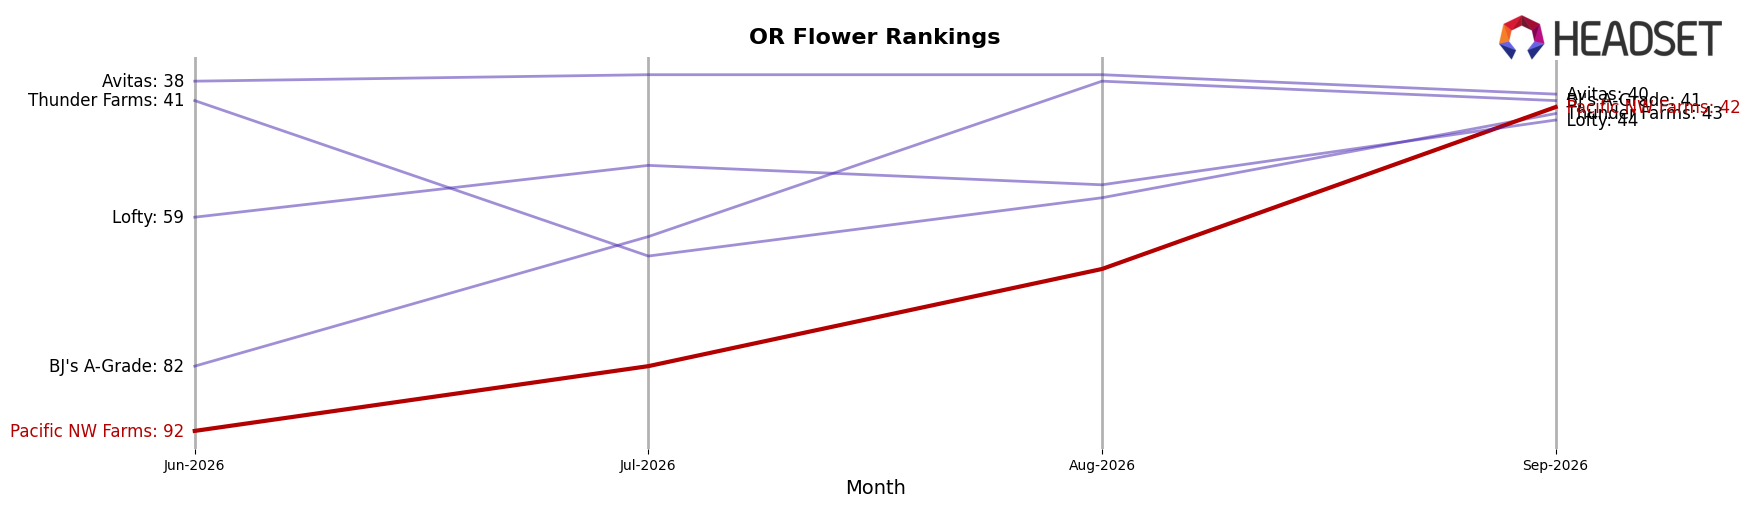
Pacific NW Farms sits at rank #42 in Oregon Flower in September 2026, improving 23 positions year over year from #65 and jumping 50 positions since June 2026 when it was #92; this marks a new peak rank in September 2026 at #42 while remaining outside the top 40. By contrast, Grown Rogue advanced to #1 from #3 year over year with a 63.8% sales increase, and Oregrown climbed to #3 from #16 alongside a 169.7% sales lift, indicating Pacific NW Farms’ rank gains are occurring alongside faster-moving leaders; the thesis is that the recent rank surge suggests momentum but also a widening gap to the top tier unless improvements convert into further double-digit rank advancement.
Notable Products
Blue Dream OG (1g) posted the sharpest movement with a 600% month-over-month surge to rank 4, while Mt. Hood Magic (Bulk) plunged 86% to rank 9, indicating momentum is concentrating in smaller-pack Flower as bulk weakens. Grape Pie (28g) jumped 200% to rank 1 and Trop Cherry (1g) rose 97% to rank 2, and with all top-10 entries in Flower the assortment is clustered in a single category that is tilting toward high-velocity grams and standout large-format winners. Scoopz (1g) fell 51% to rank 6 even as Jelly Cake (1g) grew 29% at rank 5, and OG Kush (7g) entered at rank 3 with $16,139 in sales, signaling a barbell between premium small units and selective large-format bets rather than broad-based pack-size strength.
Top Selling Cannabis Brands






Data for this report comes from real-time sales reporting by participating cannabis retailers via their point-of-sale systems, which are linked up with Headset’s business intelligence software. Headset’s data is very reliable, as it comes digitally direct from our partner retailers. However, the potential does exist for misreporting in the instance of duplicates, incorrectly classified products, inaccurate entry of products into point-of-sale systems, or even simple human error at the point of purchase. Thus, there is a slight margin of error to consider. Brands listed on this page are ranked in the top twenty within the market and product category by total retail sales volume.

