.svg)


Market Insights Snapshot
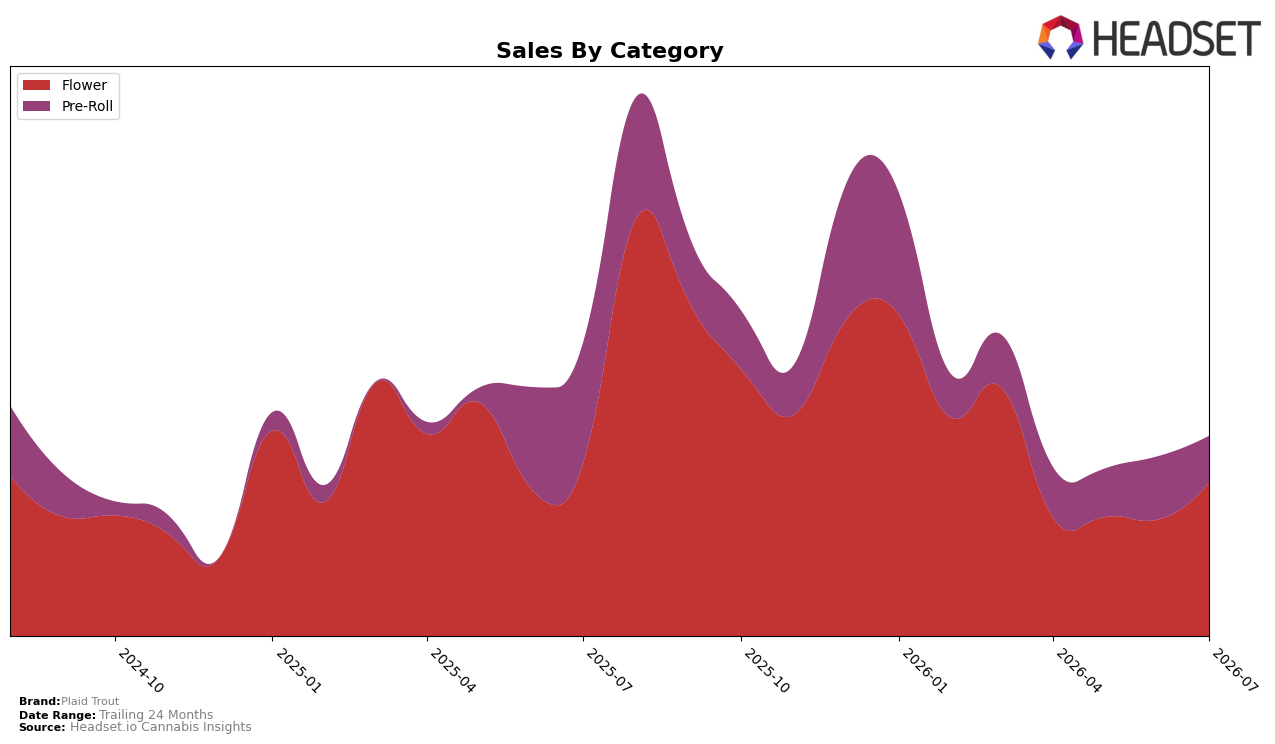
Plaid Trout concentrated 72.04% of July 2026 sales in Flower and 27.96% in Pre-Roll, with Flower up 27.02% month over month but down 9.65% year over year, while Pre-Roll fell 19.78% month over month and dropped 52.21% year over year; the average price rose 4.39% year over year to $48.42. In Alberta Flower, the brand sat at rank 47 and held Flower’s highest average item price at $94.78 relative to its own mix, which helps explain why total brand sales declined 27.67% year over year even as the month-over-month Flower rebound lifted the overall mix toward higher-priced units; the pattern implies Plaid Trout is increasingly dependent on Flower recovery while Pre-Roll contraction drags overall momentum.
The shift toward a 72.04% Flower mix alongside a 27.02% month-over-month Flower lift and a concurrent 19.78% month-over-month Pre-Roll decline points to a pricing-led, premium-leaning stance where unit elasticity in Pre-Roll is biting harder than in Flower. Holding a rank of 47 in Alberta Flower despite a 9.65% year-over-year Flower dip and a 52.21% year-over-year Pre-Roll drop suggests the brand’s positioning is anchored in higher-ticket Flower ($94.78 average item price) that can recover share sequentially even as value-driven Pre-Roll share erodes; the implication is that future gains will come from defending and trading up within Flower rather than chasing volume in a weakening Pre-Roll segment.
Competitive Landscape
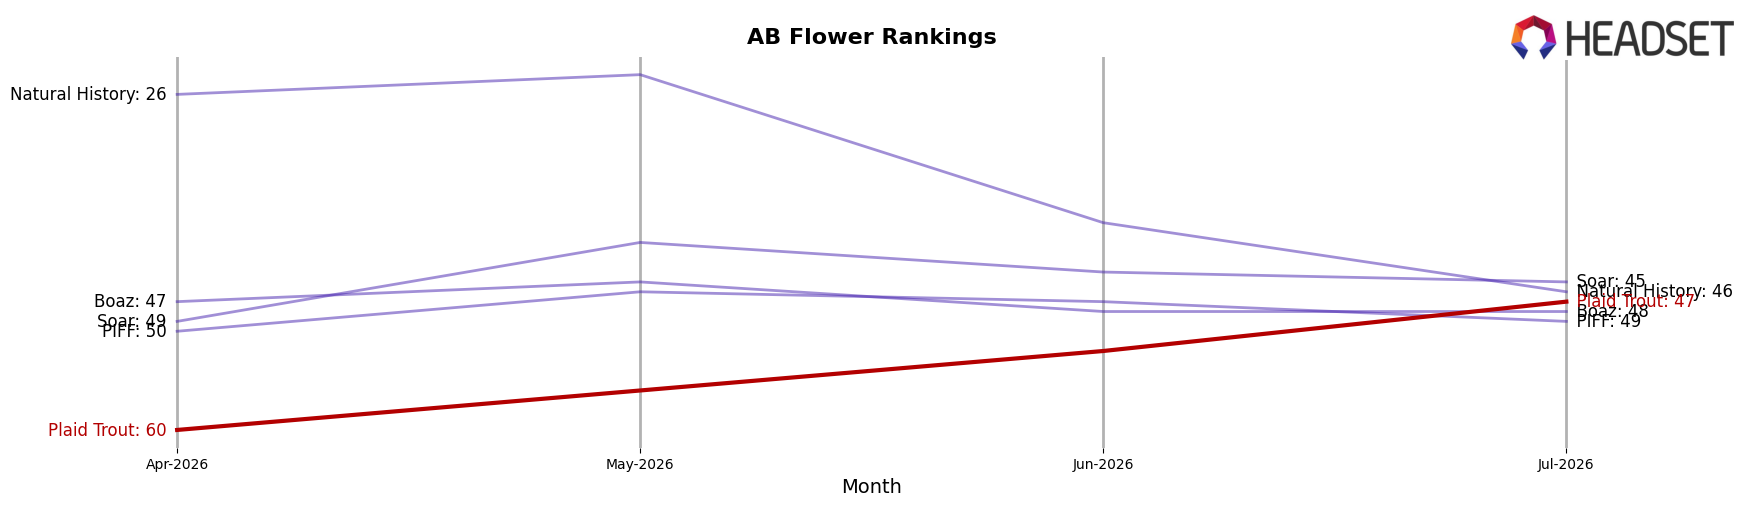
Plaid Trout sits at #47 in AB Flower for July 2026, improving 3 positions from #50 year over year and jumping 13 spots from #60 in April 2026, while still tracking below its peak of #25 from August 2025; by contrast, Back Forty / Back 40 Cannabis moved from #2 to #1 and Spinach rose from #7 to #2 with 55.6% YoY sales growth, indicating Plaid Trout’s upward drift is outpaced by leaders that are accelerating faster, which implies the brand is stabilizing off its trough but not yet regaining share at a rate sufficient to re-enter the top 30.
Notable Products
Taber Peach Pre-Roll (1g) posted the steepest decline at -15.5% and slid to rank 3, while Alberta Grown Indica (14g) fell -18.9% at rank 7, indicating softness in both single-count pre-roll and indica flower. In contrast, Bunson Honeydew Pre-Roll 10-Pack (3.5g) climbed +33.6% to rank 2 and Alberta Grown Pre-Roll 10-Pack (5g) held rank 1 despite a -4.9% dip, with four of the top ten landing in Pre-Roll, signaling multi-pack formats are consolidating share even as select singles retrench. The mix implies Plaid Trout is tilting toward value-oriented multi-pack pre-rolls and away from lower-volume singles, a direction that favors repeatable basket building over one-off trial.
Top Selling Cannabis Brands






Data for this report comes from real-time sales reporting by participating cannabis retailers via their point-of-sale systems, which are linked up with Headset’s business intelligence software. Headset’s data is very reliable, as it comes digitally direct from our partner retailers. However, the potential does exist for misreporting in the instance of duplicates, incorrectly classified products, inaccurate entry of products into point-of-sale systems, or even simple human error at the point of purchase. Thus, there is a slight margin of error to consider. Brands listed on this page are ranked in the top twenty within the market and product category by total retail sales volume.

