.svg)



Market Insights Snapshot
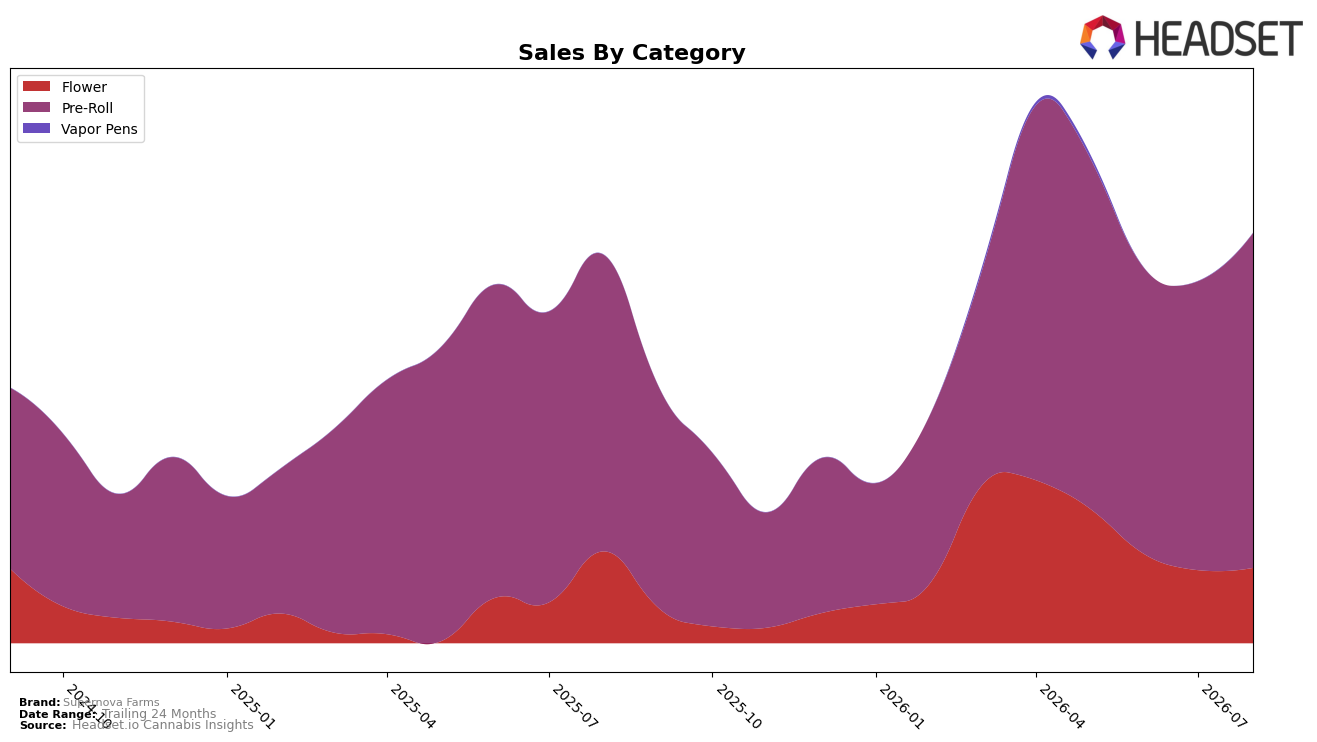
In August 2026, Supernova Farms concentrated 81.68% of sales in Pre-Roll, with Flower at 18.32%, indicating a heavier tilt toward value-led formats as average price fell 30.08% year over year alongside a brand-level sales lift of 5.66%. Within categories, Pre-Roll expanded 12.98% year over year and 15.93% month over month, while Flower contracted 18.04% year over year but inched up 3.08% month over month, suggesting the month’s volume gain came primarily from Pre-Roll while Flower provided only a modest sequential assist. Taken together, the mix shift points to price-elastic demand pooling into Pre-Roll at a sub-$10 average, and the combination of double-digit Pre-Roll growth and a smaller, declining Flower base implies the brand is trading breadth for depth within one format.
The mix concentration sets a positioning anchored in value-forward Pre-Roll in Alberta, where the brand’s Pre-Roll rank at 47 indicates mid-pack visibility that can be leveraged by sustaining month-over-month Pre-Roll momentum of 15.93% while stabilizing Flower’s 18.04% year-over-year decline. With a 77.98% two-year sales increase coexisting with a 30.08% price cut and a 12.98% Pre-Roll category lift, the brand’s current edge rests on price-led penetration rather than multi-category span, implying near-term share gains are more likely from deepening Pre-Roll presence than from reviving Flower unless pricing and pack architecture can convert Flower’s 3.08% monthly uptick into repeatable volume.
Competitive Landscape
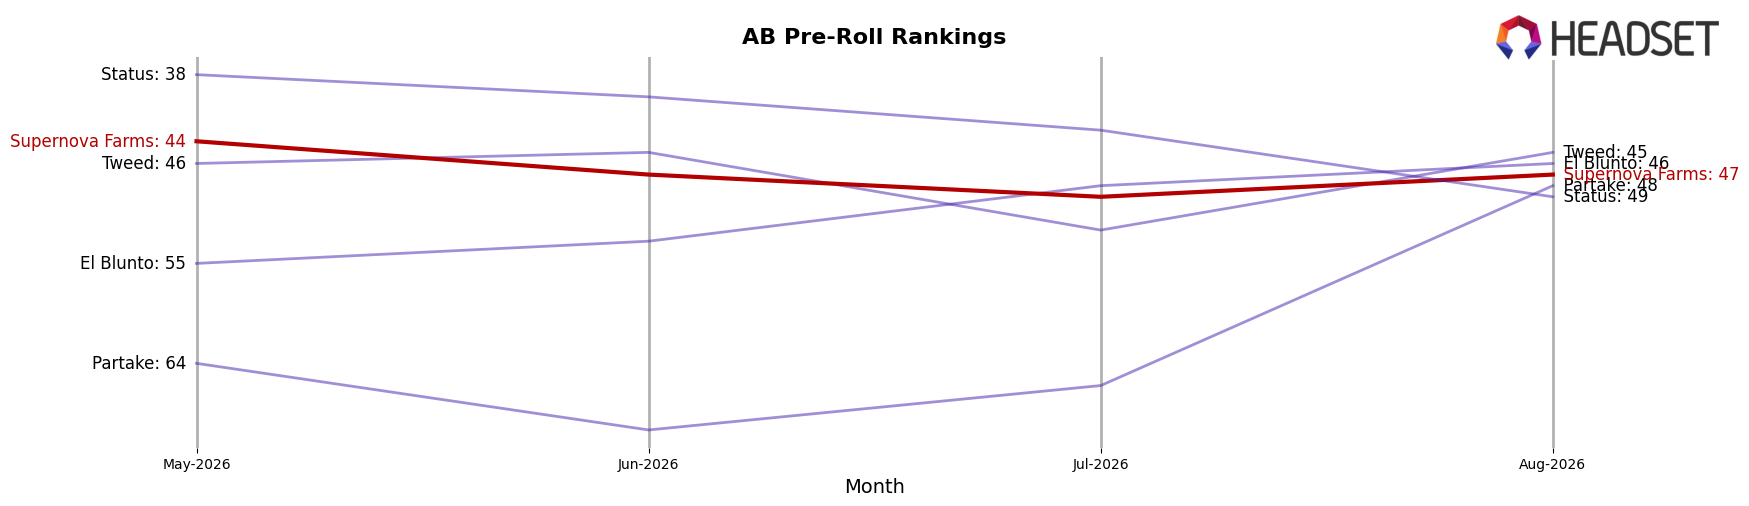
Supernova Farms sits at rank #47 in AB Pre-Roll for August 2026, a 20-place improvement from rank #67 in August 2025, yet it has slipped 3 spots from rank #44 in May 2026 when it hit its recent peak. The top of the board has been fluid: Back Forty / Back 40 Cannabis moved up from #5 to #1 with a 50.3% year-over-year sales increase, while General Admission slid from #1 to #2 amid a -20.8% change, and Thumbs Up Brand advanced from #18 to #4 on 135.1% growth. These shifts imply that Supernova Farms’ 20-rank YoY climb is occurring in a churn-heavy tier where rapid share reallocation favors brands with accelerating momentum, so maintaining gains will require converting the May 2026 peak positioning into sustained monthly rank stability.
Notable Products
B!tch Slap Pre-Roll (0.5g) delivered the largest month-over-month surge at +112% while jumping into rank 2, as WTF Strawberry Pre-Roll (0.5g) rose +51% to hold rank 1. In contrast, Maui Wowie Pre-Roll (0.5g) slid -25% to rank 8, and Road Rage OG Pre-Roll (0.5g) eased -2.7% at rank 3, with the Bitch Slap Pre-Roll 3-Pack (1.5g) down -4.8% at rank 4. Eight of the top ten are Pre-Rolls, and WTF Strawberry Pre-Roll 3-Pack (1.5g) stayed near flat at -0.8% in rank 6 while Maui Wowie Pre-Roll 3-Pack (1.5g) in rank 9 inched up +3.6%, indicating single-stick momentum is carrying the lineup even as multi-packs stabilize around a $30,506 ceiling. The pattern implies Supernova Farms is consolidating leadership around high-velocity single Pre-Rolls while tolerating targeted SKU declines to streamline a Pre-Roll–heavy portfolio.
Top Selling Cannabis Brands






Data for this report comes from real-time sales reporting by participating cannabis retailers via their point-of-sale systems, which are linked up with Headset’s business intelligence software. Headset’s data is very reliable, as it comes digitally direct from our partner retailers. However, the potential does exist for misreporting in the instance of duplicates, incorrectly classified products, inaccurate entry of products into point-of-sale systems, or even simple human error at the point of purchase. Thus, there is a slight margin of error to consider. Brands listed on this page are ranked in the top twenty within the market and product category by total retail sales volume.

