.svg)

Aug-2026
Sales
Trend
6-Month
Product Count
SKUs
Avg Price
YoY Sales Change
YoY Price Change


Market Insights Snapshot
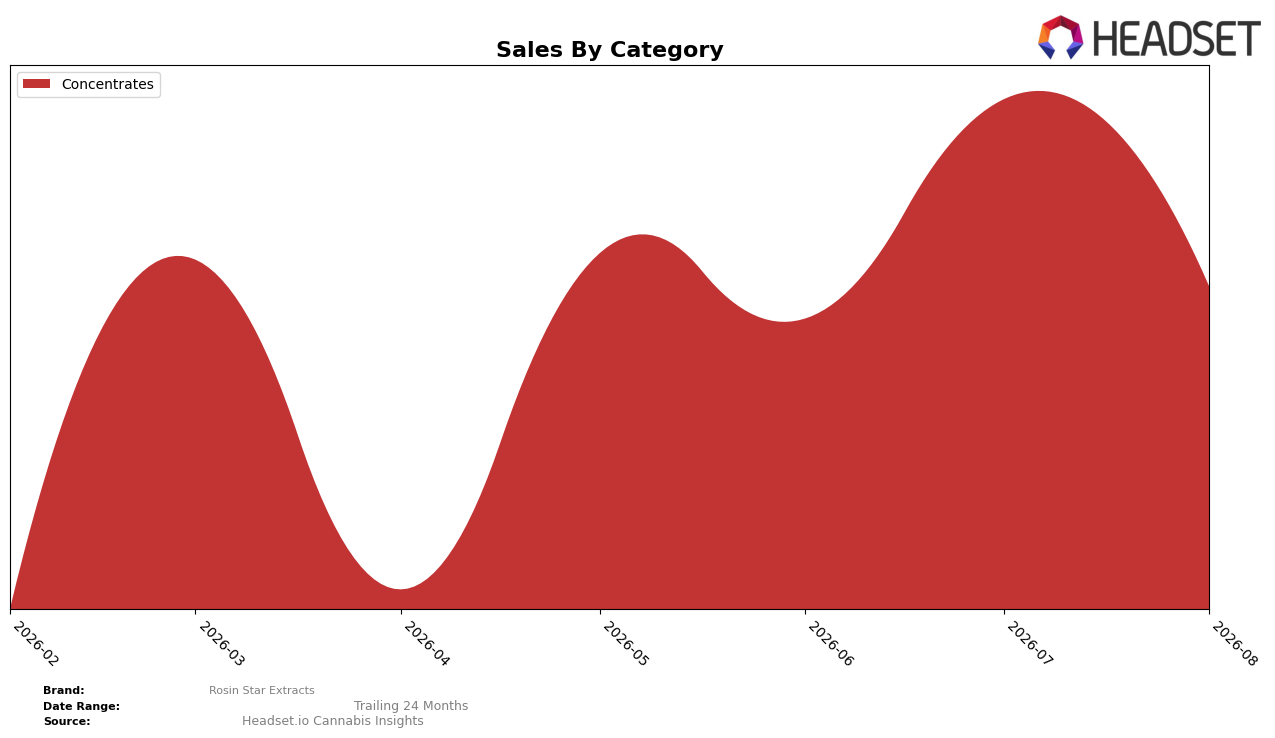
In August 2026, Rosin Star Extracts operated as a single-category brand with Concentrates at 100.0% share, and the category posted a month-over-month change of -32.15% alongside a category rank of 43 in Ontario. With no year-over-year figure reported, the month-over-month contraction and a 100.0% concentration in one category indicate exposure to short-term volatility; the thesis is that the all-in Concentrates mix amplifies sensitivity to monthly demand swings while the rank of 43 limits immediate visibility in Ontario.
The August 2026 -32.15% month-over-month movement, combined with a 100.0% category concentration, implies that brand positioning depends on stabilizing repeat purchases and price/format strategy within Concentrates rather than cross-category insulation. Given a rank of 43 in Ontario and an average price near $51.81, the pattern suggests a need to tighten SKU focus toward faster-velocity Concentrates subtypes and channel slots that can smooth month-to-month variance, because single-category dependence compresses headroom for rank improvement when demand cools.
Competitive Landscape
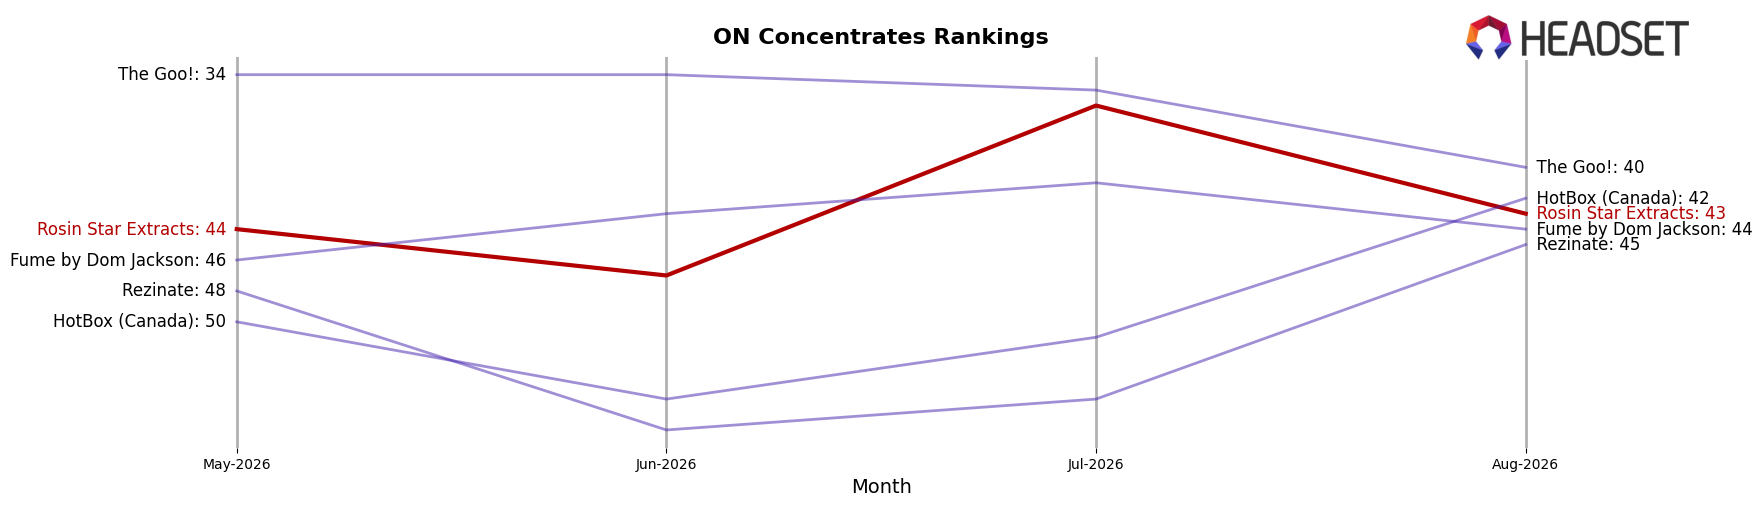
Rosin Star Extracts is ranked #43 in ON Concentrates in August 2026, improving 1 position from #44 in May 2026 but sitting 7 spots below its peak at #36 in July 2026; the lack of a year-over-year rank baseline limits historical context, yet the recent month-to-month movement is visible. In contrast, Vortex Cannabis Inc. holds #1 with a year-over-year rank of #1 and sales up 8.4%, while BoxHot sits at #4 after rising from #9 year-over-year with sales up 58.8%, indicating that the top tier is consolidating faster than mid-pack brands. Meanwhile, Endgame is #5 with a year-over-year rank of #3 and sales down 33.0%, and Nugz (Canada) is #3 with a year-over-year rank of #2 and sales down 7.7%, suggesting volatility at the top that Rosin Star Extracts has not converted into share gains despite a 1-rank uptick since May 2026. The pattern implies a stalled climb: a brief peak at #36 in July 2026 followed by a slide to #43 in August 2026 points to fragile placement that will require either sustained velocity gains or assortment resets to avoid drifting out of the top 50.
Notable Products
Fruit Melodies Live Hash Rosin (1g) led August 2026 yet dropped 29.7% month over month while holding rank 1, and Pomelo Cake Live Hash Rosin Fruit Melodies (1g) fell 26.2% at rank 2, concentrating the top two entirely in Concentrates. With no recorded rank for Tropical Lime Live Hash Rosin (1g) and a $24,420 anchor from the leader, the pattern points to reliance on a single flagship while the runner-up underperforms, implying near-term vulnerability if the category cools further and a need to diversify the SKU mix beyond a narrow Concentrates core.
Top Selling Cannabis Brands






Data for this report comes from real-time sales reporting by participating cannabis retailers via their point-of-sale systems, which are linked up with Headset’s business intelligence software. Headset’s data is very reliable, as it comes digitally direct from our partner retailers. However, the potential does exist for misreporting in the instance of duplicates, incorrectly classified products, inaccurate entry of products into point-of-sale systems, or even simple human error at the point of purchase. Thus, there is a slight margin of error to consider. Brands listed on this page are ranked in the top twenty within the market and product category by total retail sales volume.

