.svg)
Aug-2026
Sales
Trend
6-Month
Product Count
SKUs
Avg Price
YoY Sales Change
YoY Price Change


Where to Buy
Rosinade is stocked at 51 licensed dispensaries across Washington, with the deepest coverage in Seattle, Spokane, Tacoma, Everett, and Lynnwood. Search by ZIP code or city below to find the closest one, or filter by product type if you are after a specific format.
Market Insights Snapshot
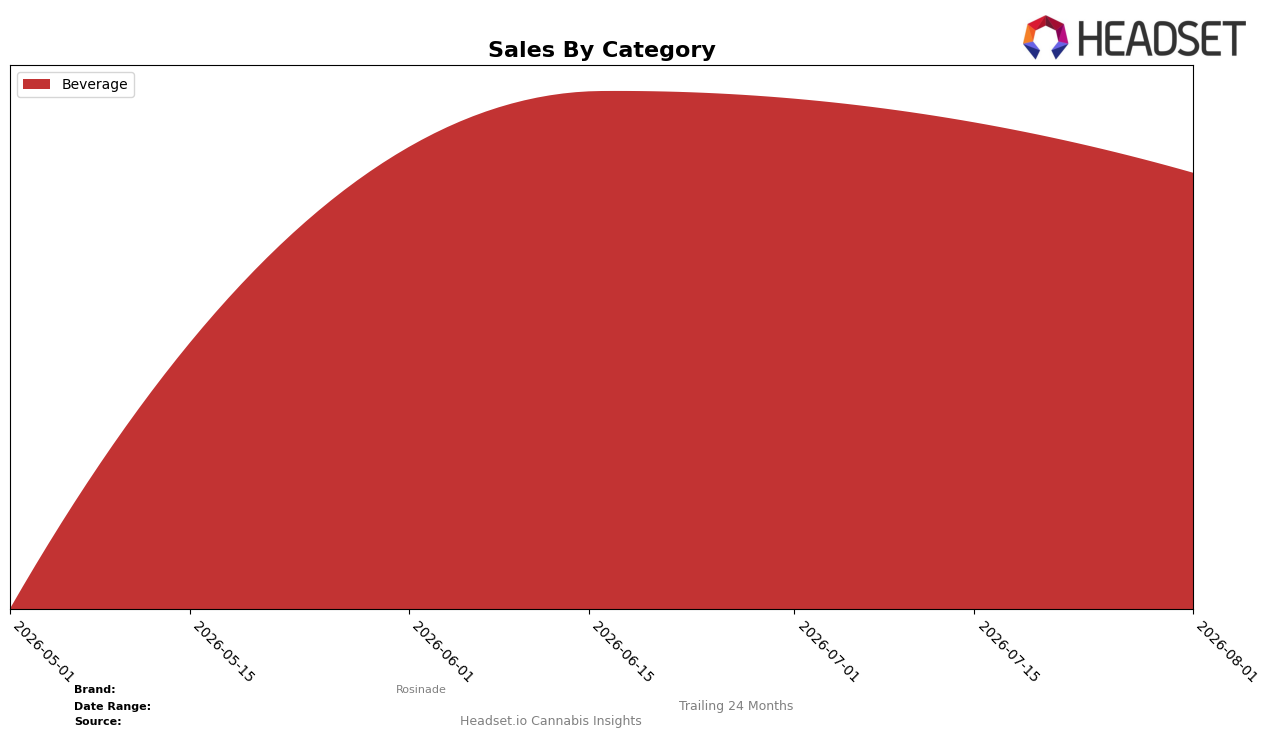
Rosinade operated as a single-category play in Beverage with a 100.0% mix in August 2026, and the category’s month-over-month change of -10.82% concentrated all volatility into one lane. With no reported year-over-year percentage and a current average price of $8.80, the pricing lens lacks a YoY anchor, but the single-category exposure means any August 2026 contraction immediately maps to brand-level softness. In Washington Beverage, a rank of 17 places Rosinade behind mid-pack leaders, and the fully concentrated 100.0% share of mix implies limited buffer if Beverage demand continues to slide; together, -10.82% MoM and rank 17 point to category dependence that amplifies downside risk.
The August 2026 shift implies Rosinade’s positioning is tethered to Beverage momentum rather than portfolio balance, with the 100.0% category mix magnifying the -10.82% MoM pullback into a visibility issue at rank 17. With no YoY percentage to counterbalance the August 2026 narrative, the brand’s August exposure suggests a need to defend Beverage shelf presence and velocity levers to avoid further rank pressure; the combination of 100.0% concentration and 17th in Washington indicates that even small percentage losses can push Rosinade down the consideration set, while any incremental percentage gains could disproportionately lift rank given the single-lane focus.
Competitive Landscape
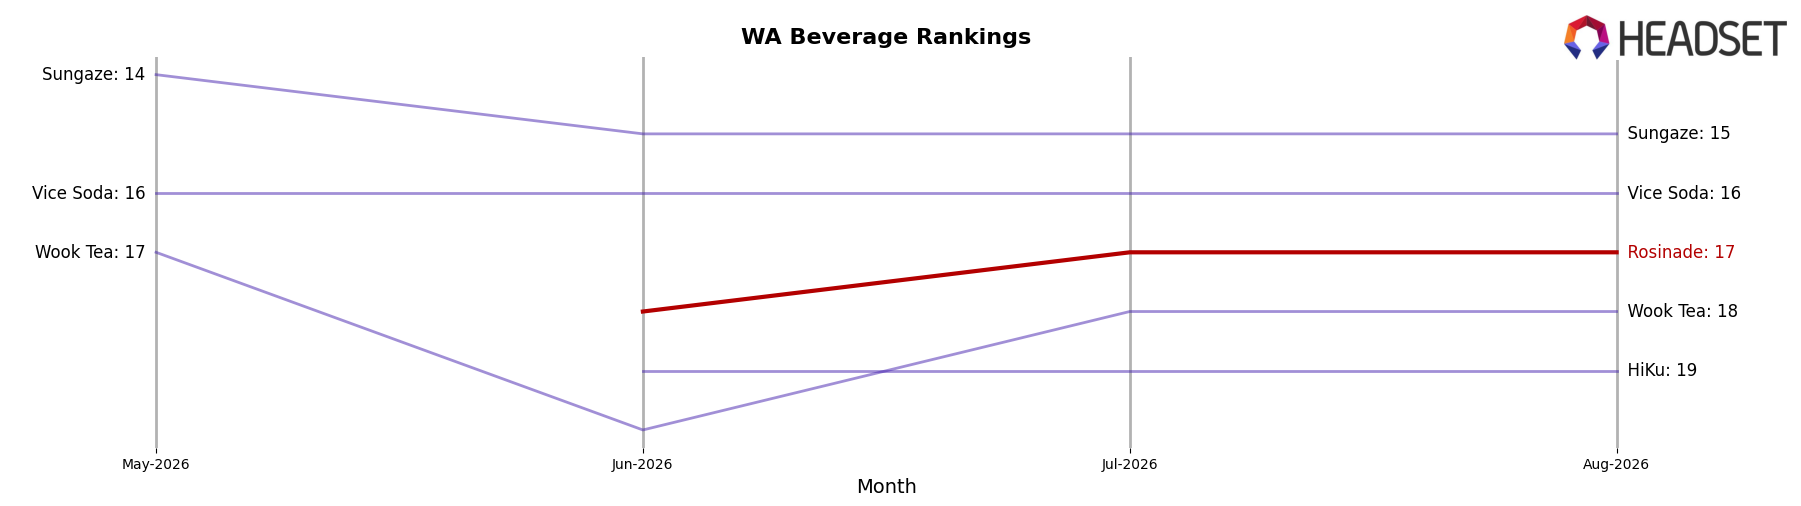
Rosinade sits at #17 in WA Beverage with a 6-place climb from #23 in May 2026 to #17 in August 2026, marking its peak rank in August 2026; this upward move contrasts with Journeyman holding #1 while down from #2 a year ago and Blaze Soda rising from #9 to #4 alongside a 123.8% YoY sales change. Compared with Ray's Lemonade slipping from #1 to #2 on a -31.6% YoY sales change and Green Revolution easing from #4 to #5 with -38.6% YoY, Rosinade’s ascent from #23 to #17 over three months implies momentum is driven more by competitor retrenchment than by category-wide expansion, pointing to a window to consolidate gains before rank volatility normalizes.
Notable Products
Strawberry Dragon Fruit Lemonade (100mg THC, 7.4oz, 220ml) posted the steepest movement in August 2026 with a -18.99% month-over-month decline while sliding to rank 2, whereas Pineapple Passion Fruit Lemonade(100mg THC, 7.4oz) rose +10.01% to hold rank 1. Original Lemonade (100mg THC, 7.4oz) fell -28.35% and sits at rank 4, and Pom Cherry Rosin Lemonade (100mg THC, 7.4oz, 220ml) dipped -3.83% at rank 3. All top ten SKUs come from Beverages, concentrating the mix in a single category and signaling that Rosinade’s near-term commercial direction is anchored in flavor-led Beverage leadership rather than category expansion.
Top Selling Cannabis Brands






Data for this report comes from real-time sales reporting by participating cannabis retailers via their point-of-sale systems, which are linked up with Headset’s business intelligence software. Headset’s data is very reliable, as it comes digitally direct from our partner retailers. However, the potential does exist for misreporting in the instance of duplicates, incorrectly classified products, inaccurate entry of products into point-of-sale systems, or even simple human error at the point of purchase. Thus, there is a slight margin of error to consider. Brands listed on this page are ranked in the top twenty within the market and product category by total retail sales volume.

