.svg)
Jul-2026
Sales
Trend
6-Month
Product Count
SKUs
Avg Price
YoY Sales Change
YoY Price Change


Market Insights Snapshot
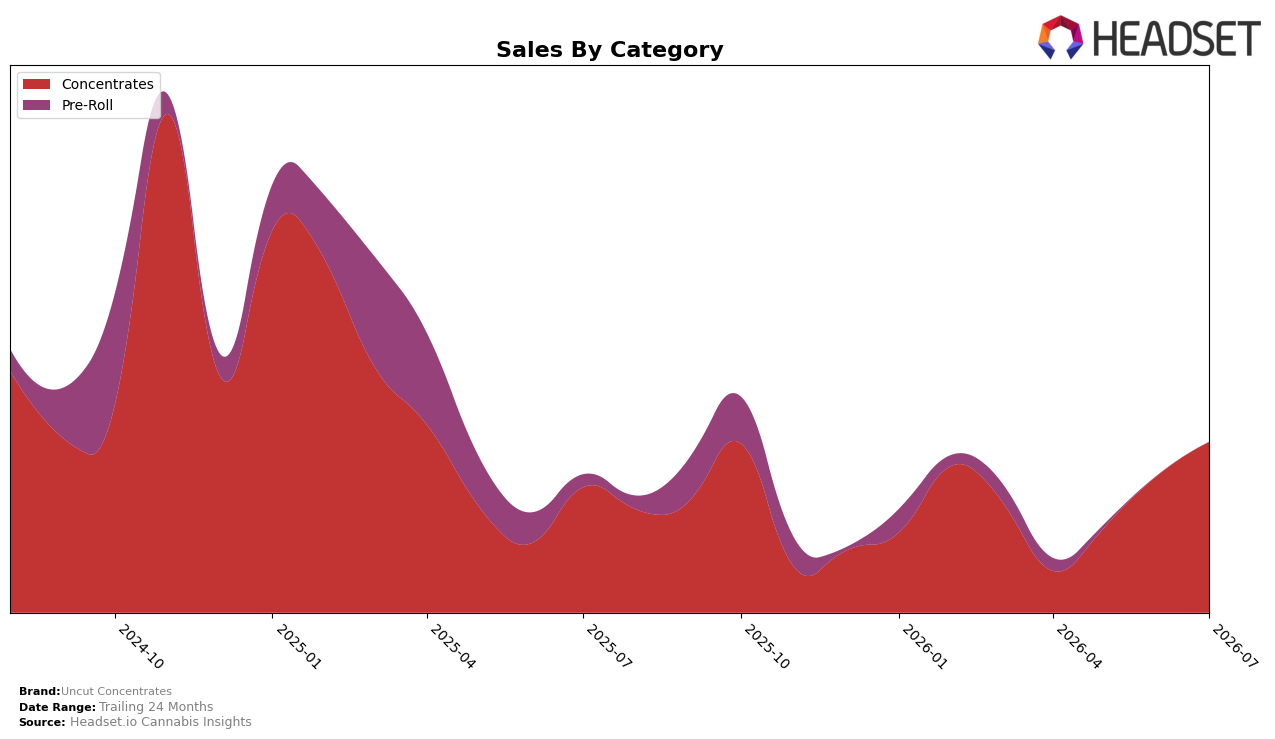
In July 2026, Uncut Concentrates operated as a single-category brand in Concentrates, with 100.0% of sales concentrated in that segment and an average price of $22.67. Within Concentrates, sales grew 36.15% year over year and 24.18% month over month, while the brand-level sales growth was 23.66% YoY alongside a 28.06% YoY decline in average price. The category concentration at 100.0% combined with a 24.18% MoM uptick and a 36.15% YoY gain indicates that mix-driven momentum is entirely tied to Concentrates, implying limited diversification but clear volume sensitivity to price in July 2026.
Positionally, Uncut Concentrates held rank 43 in Concentrates in Massachusetts while posting a 24.18% MoM lift and a 36.15% YoY increase in its sole category, suggesting that the current placement is more consistent with price-led share capture than breadth of assortment. With brand sales up 23.66% YoY against a 28.06% YoY price decline and a 51.78% drop over 24 months, the July 2026 setup implies near-term elasticity advantages but a need to convert price-driven gains into sustained rank improvement within Concentrates.
Competitive Landscape
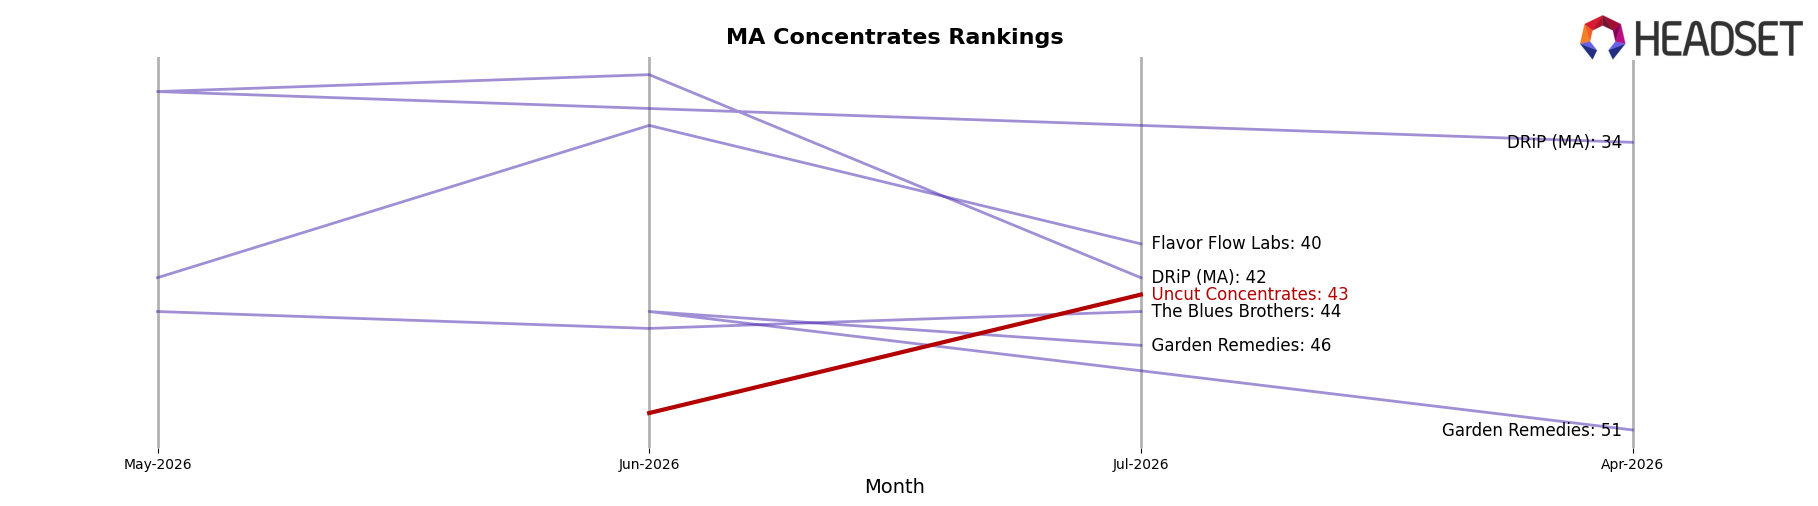
Uncut Concentrates sits at rank #43 in July 2026, a 14-place improvement from #57 year over year, and a 35-place climb from #78 three months prior, indicating share recovery from its November 2024 peak at #23. Meanwhile, Good Chemistry Nurseries held #1 year over year and remains #1 with an 81.5% YoY sales increase, while Crispy Commission Concentrates stayed at #2 despite a 21.5% YoY sales decline, signaling that top-tier stability coexists with divergent growth paths; this pattern implies Uncut Concentrates’ upward rank trajectory is driven by relative gains against mid-pack brands rather than displacement of the entrenched top two.
Notable Products
Gush Mints Sugar (1g) posted the largest month-over-month surge at 301.35% and reached rank 3, while Candy Glue Live Sand (1g) jumped 122.86% to rank 1, indicating a decisive pivot toward sugar and live sand textures. In contrast, GMO Bomb Live Micro Diamonds and Sauce (1g) fell 44.37% to rank 2, creating a gap between the ascendant formats and traditional diamonds-and-sauce; combined with two top-three ranks and one mid-pack decline, this mix implies Uncut Concentrates is consolidating share by leaning into faster-moving live sand and sugar SKUs.
Top Selling Cannabis Brands






Data for this report comes from real-time sales reporting by participating cannabis retailers via their point-of-sale systems, which are linked up with Headset’s business intelligence software. Headset’s data is very reliable, as it comes digitally direct from our partner retailers. However, the potential does exist for misreporting in the instance of duplicates, incorrectly classified products, inaccurate entry of products into point-of-sale systems, or even simple human error at the point of purchase. Thus, there is a slight margin of error to consider. Brands listed on this page are ranked in the top twenty within the market and product category by total retail sales volume.

