.svg)

Aug-2026
Sales
Trend
6-Month
Product Count
SKUs
Avg Price
YoY Sales Change
YoY Price Change


Market Insights Snapshot
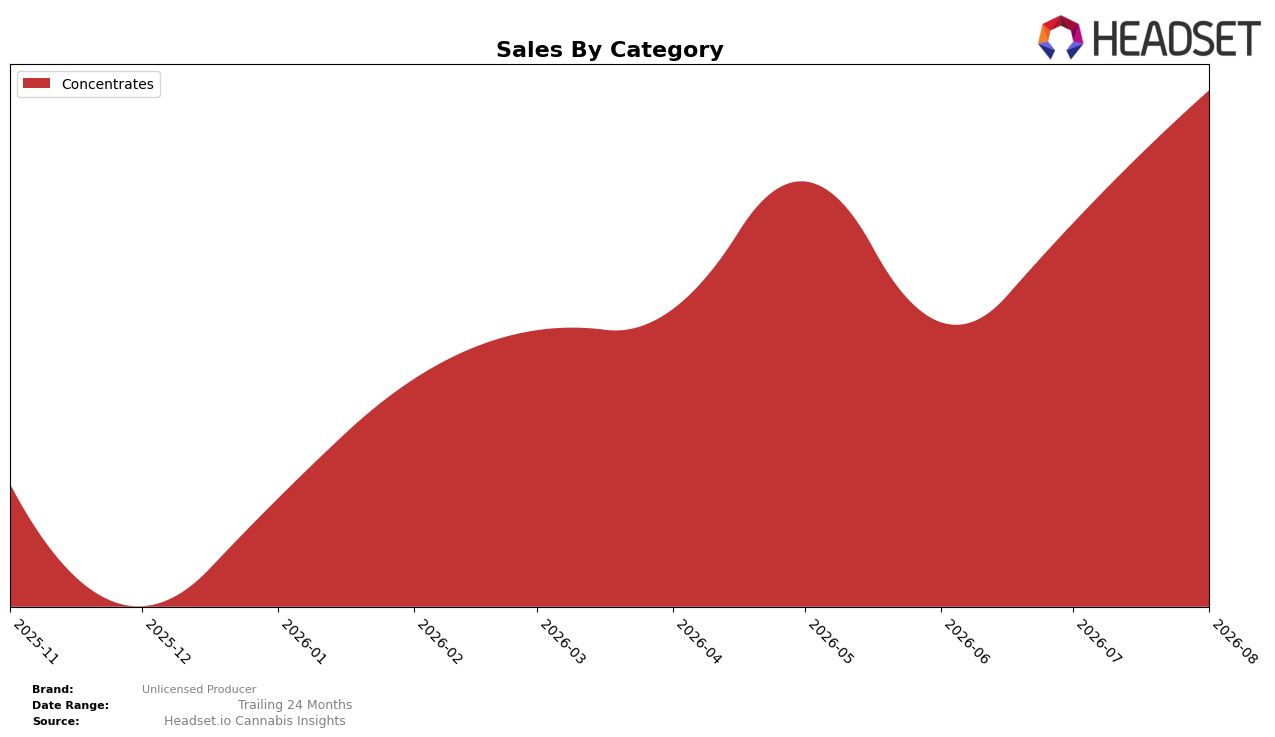
In August 2026, Unlicensed Producer operated as a single-category brand with Concentrates at 100.0% mix share and a month-over-month sales change of 27.4%, while the category count remained at one and the category rank in Ontario Concentrates held at 20. The absence of a reported year-over-year percentage for Concentrates alongside a 27.4% month-over-month gain indicates reliance on short-cycle momentum rather than multi-period expansion, implying that concentration risk is rising even as recent velocity improves.
Holding the 20 rank in Ontario Concentrates while carrying a 100.0% category mix and a 27.4% month-over-month lift suggests the brand’s positioning is anchored to niche depth rather than breadth, with pricing at an average of $56.01 supporting a focused rather than diversified basket role. The combination of a single-category footprint (100.0% share) and a mid-pack rank position (20) implies the brand is competing on specific format or potency attributes within Concentrates, and the 27.4% month-over-month increase points to tactical wins that may not compound without adjacent-category expansion.
Competitive Landscape
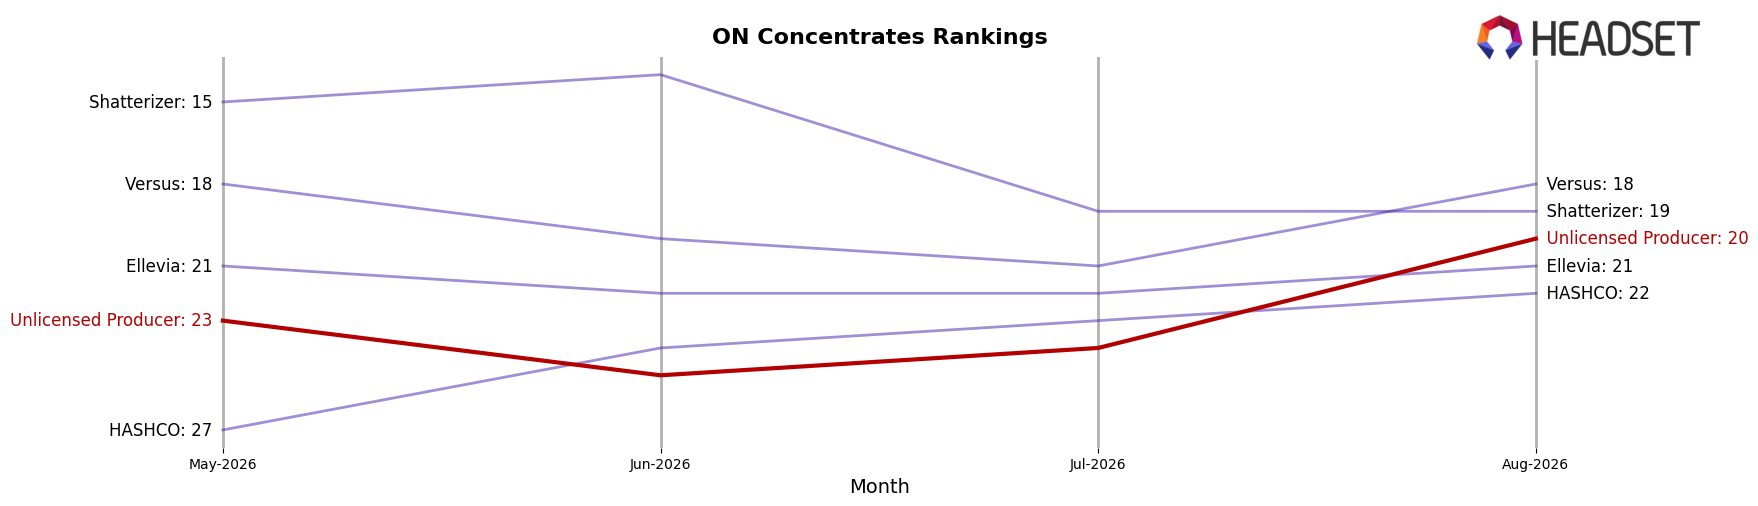
Unlicensed Producer sits at rank #20 in ON Concentrates in August 2026, a climb of 3 positions from #23 in May 2026, and matching its peak rank of #20 in August 2026; meanwhile, category leaders shifted as Pura Vida moved up from #4 to #2 year over year while Endgame slipped from #3 to #5 with a -32.97% sales change. Against the top spot, Vortex Cannabis Inc. held #1 with an 8.44% YoY sales increase while BoxHot advanced from #9 to #4 on 58.84% YoY growth, indicating that while Unlicensed Producer is progressing within the top-20, the upper tier is consolidating around brands with faster upward mobility; the trajectory implies a foothold has been established, but continued share gains will require outpacing competitors that are ascending multiple ranks per year.
Notable Products
Banana Fuel Live Rosin (1g) posted the steepest movement in August 2026 with a -87.3% month-over-month drop and slid to rank 4, while Single Source Live Rosin (1g) rose 40.9% MoM and held rank 1. Champaya Live Rosin (1g) climbed 71.9% MoM to rank 3, and Champaya Single Source Live Rosin (4g) advanced 63.2% MoM to rank 2, concentrating all top-five positions in Concentrates. With four of the top five showing either 60%+ gains or 70%+ declines, the mix indicates volatile demand cycling around live rosin formats, implying Unlicensed Producer is leaning into high-velocity flagship SKUs while pruning underperforming variants.
Top Selling Cannabis Brands






Data for this report comes from real-time sales reporting by participating cannabis retailers via their point-of-sale systems, which are linked up with Headset’s business intelligence software. Headset’s data is very reliable, as it comes digitally direct from our partner retailers. However, the potential does exist for misreporting in the instance of duplicates, incorrectly classified products, inaccurate entry of products into point-of-sale systems, or even simple human error at the point of purchase. Thus, there is a slight margin of error to consider. Brands listed on this page are ranked in the top twenty within the market and product category by total retail sales volume.

