.svg)


Market Insights Snapshot
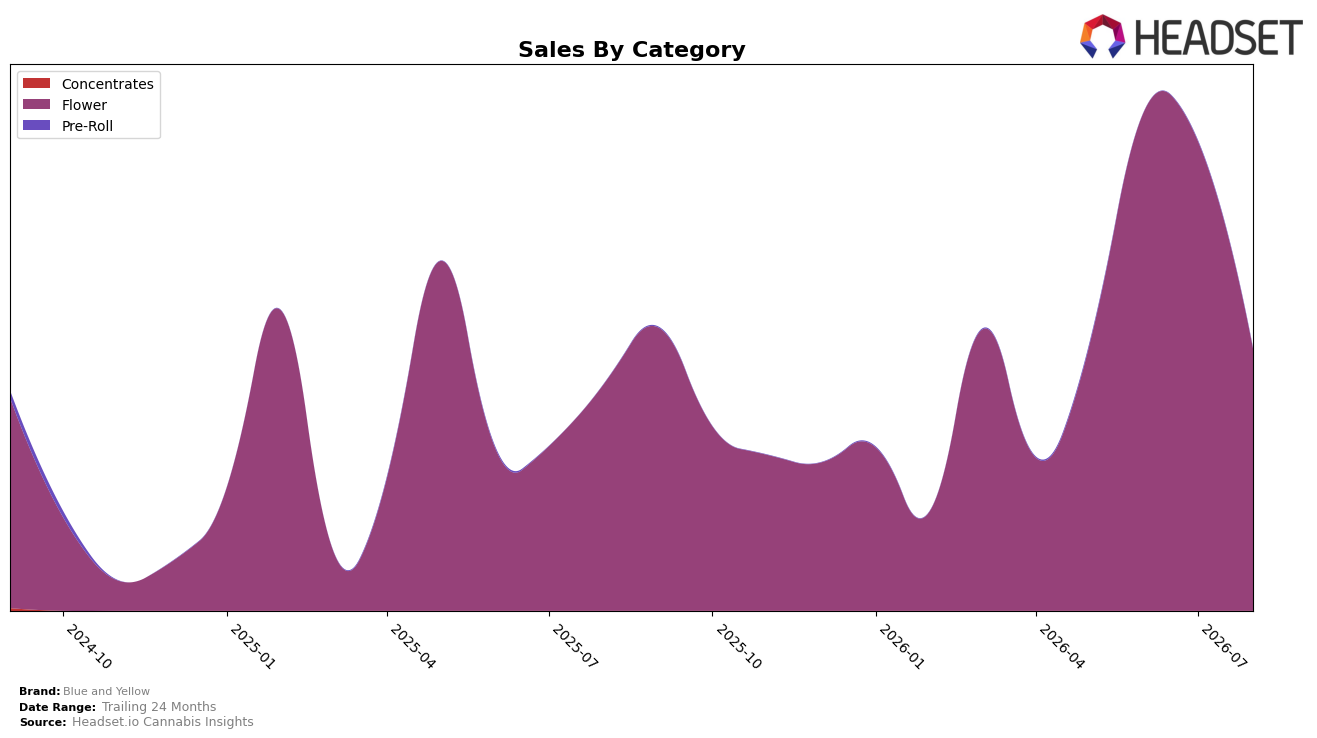
In August 2026, Blue and Yellow concentrated 99.72% of sales in Flower while Pre-Roll accounted for 0.28%, indicating a narrowly focused mix; within Flower, year-over-year growth was 15.39% but month-over-month declined 44.27%, and Pre-Roll also slipped month-over-month by 7.21%. With average price up 8.78% year-over-year to $17.08 and Flower’s average price at $17.53, the mix skews toward higher-ticket Flower even as near-term volume pressure intensifies, implying a reliance on Flower elasticity that could magnify volatility when monthly swings approach a 40%+ contraction.
Blue and Yellow’s 47 rank in Flower in Oregon alongside a 15.71% brand-level year-over-year sales gain and a 44.27% monthly decline in its dominant category signals an exposure to rank erosion when Flower softens, while the 0.28% share in Pre-Roll is too small to offset category shocks. The 24-month brand sales increase of 41.02% coupled with a 99.72% Flower dependency suggests the current positioning trades breadth for depth, implying that small share reallocation toward Pre-Roll or adjacent formats could reduce drawdown risk without sacrificing the pricing power implied by an 8.78% average price lift.
Competitive Landscape
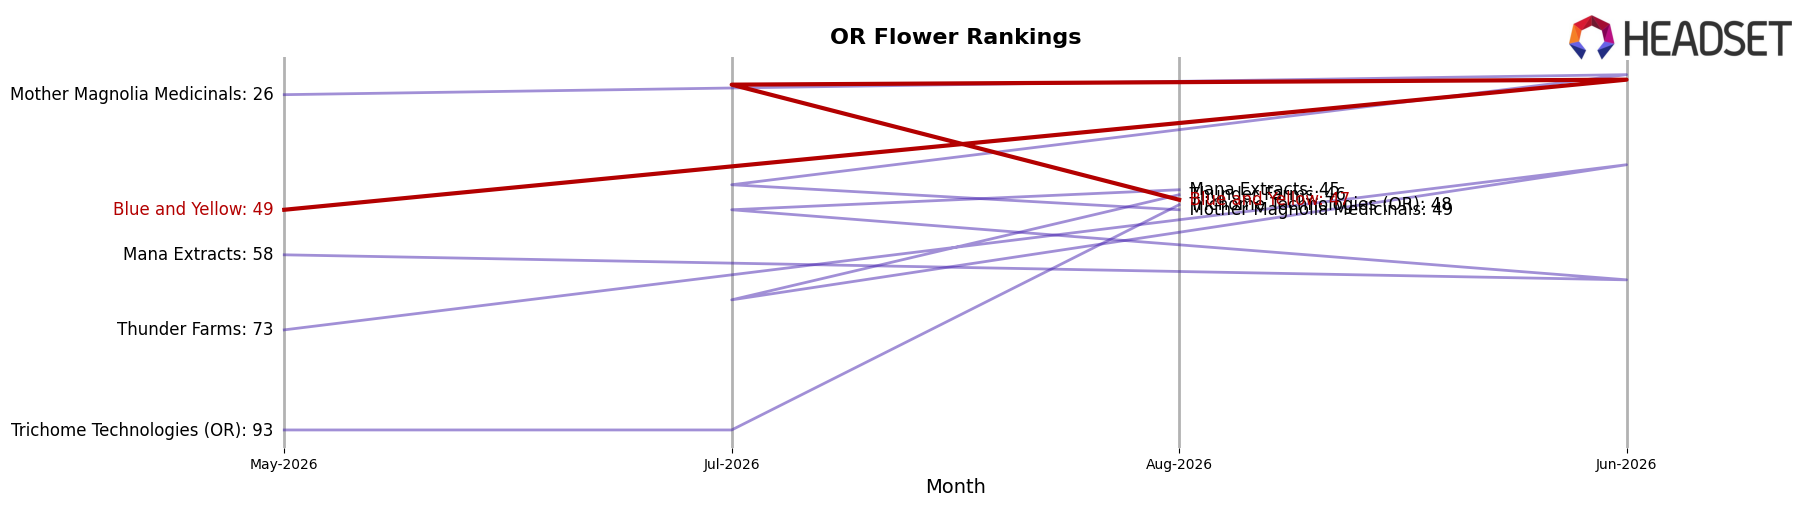
Blue and Yellow sits at #47 in OR Flower in August 2026, improving 12 spots from #59 year over year and edging 2 positions from #49 in May-to-August momentum, but still well below its peak of #23 in June 2026 and trailing the top tier where Grown Rogue moved up from #3 to #1 while PRUF Cultivar / PRŪF Cultivar slipped from #1 to #2; the contrast with Oregrown climbing from #23 to #3 and Panda Farms vaulting from #99 to #4 indicates that Blue and Yellow’s incremental rank gains are being outpaced by rapid movers, implying its current trajectory points to mid-pack stabilization rather than a return to the top-25 without a sharper acceleration.
Notable Products
Illemonatti (3.5g) posted the steepest movement in August 2026 with a -64.6% month-over-month drop while sitting at rank 6, signaling an abrupt pullback in smaller package demand even as top slots were held by larger formats. Gelato 33 (Bulk) led at rank 1 and Zerealz (Bulk) sat at rank 4, and with eight of the top ten being Flower SKUs the lineup remains heavily concentrated in a single category, pointing to reliance on bulk and larger-size Flower to carry share. Hashburger B's (14g) at rank 3 reinforces that mid-to-large pack sizes are anchoring the leaderboard, whereas the lone sharp decline in a 3.5g SKU suggests format mix is shifting up-market on size rather than breadth of categories. Taken together, the product mix implies Blue and Yellow is leaning into bulk Flower leadership while de-emphasizing smaller units, a direction that prioritizes volume efficiency over SKU variety.
Top Selling Cannabis Brands






Data for this report comes from real-time sales reporting by participating cannabis retailers via their point-of-sale systems, which are linked up with Headset’s business intelligence software. Headset’s data is very reliable, as it comes digitally direct from our partner retailers. However, the potential does exist for misreporting in the instance of duplicates, incorrectly classified products, inaccurate entry of products into point-of-sale systems, or even simple human error at the point of purchase. Thus, there is a slight margin of error to consider. Brands listed on this page are ranked in the top twenty within the market and product category by total retail sales volume.

