.svg)


Where to Buy
Resin Ranchers is stocked at 34 licensed dispensaries across Oregon, with the deepest coverage in Portland, Bend, Corvallis, Eugene, and Ontario. Search by ZIP code or city below to find the closest one, or filter by product type if you are after a specific format.
Market Insights Snapshot
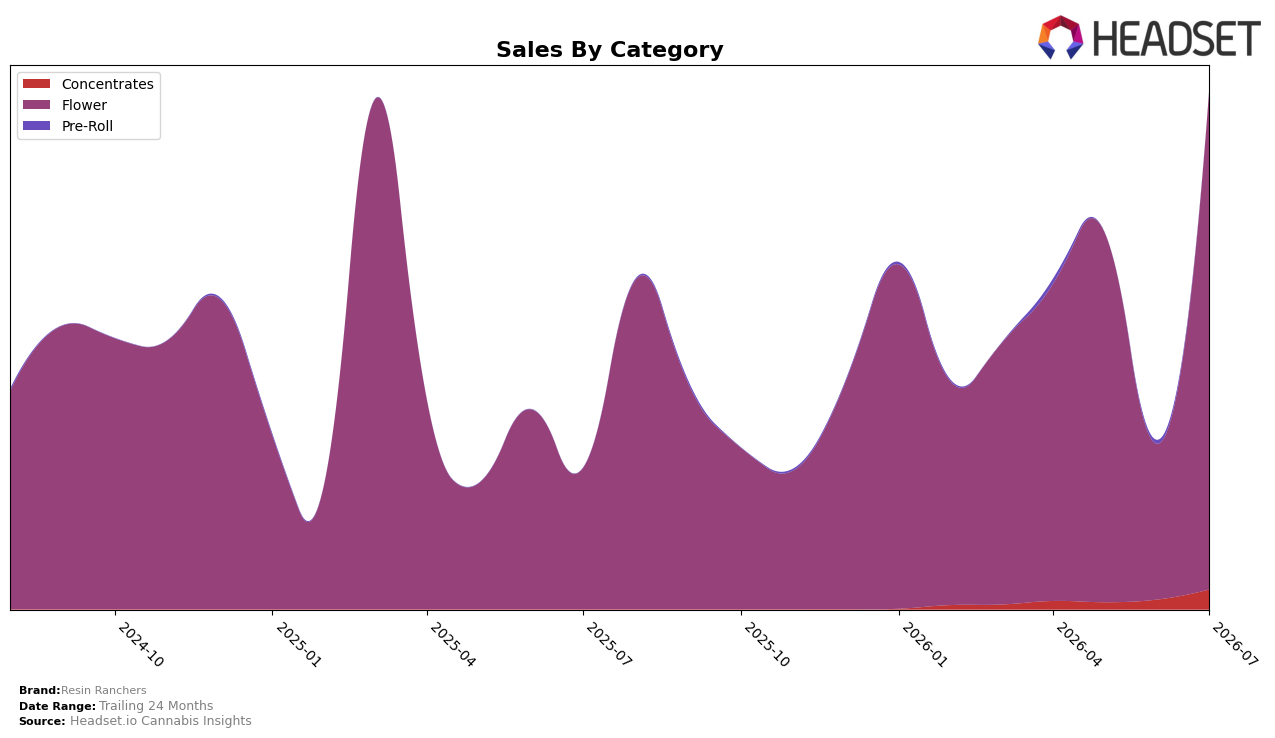
In July 2026, Resin Ranchers concentrated 96.19% of sales in Flower, with Concentrates holding 3.81%, and the Flower line expanded 253.81% year over year while surging 220.59% month over month; meanwhile, Concentrates doubled month over month at 103.58% but had no reported year-over-year baseline. The average price fell 17.18% year over year to $32.34 even as total brand sales rose 267.83% year over year, signaling that volume gains outpaced pricing pressure; within the mix, Flower’s average price of 32.10 sat below Concentrates at 39.92, aligning the growth with a value-leaning core. The combination of a 279.25% two-year expansion and a July spike in Flower concentration implies Resin Ranchers is leaning into a scaled, lower-priced Flower engine that is powering outsized volume growth.
Positionally, anchoring 96.19% of sales in Flower while holding a rank of 41 in Oregon Flower suggests Resin Ranchers is prioritizing depth over breadth, using a 17.18% price decline alongside a 220.59% month-over-month Flower surge to capture share via accessible price points and throughput. The 103.58% month-over-month lift in Concentrates alongside a 3.81% share indicates early traction without material dilution of the Flower-led identity, and the 267.83% brand sales year-over-year growth against a 253.81% Flower year-over-year rate implies incremental gains are still coming from the core rather than diversification. This pattern implies the near-term path is to consolidate rank through scale efficiency in Flower while pacing Concentrates as an option value rather than a mix pivot.
Competitive Landscape
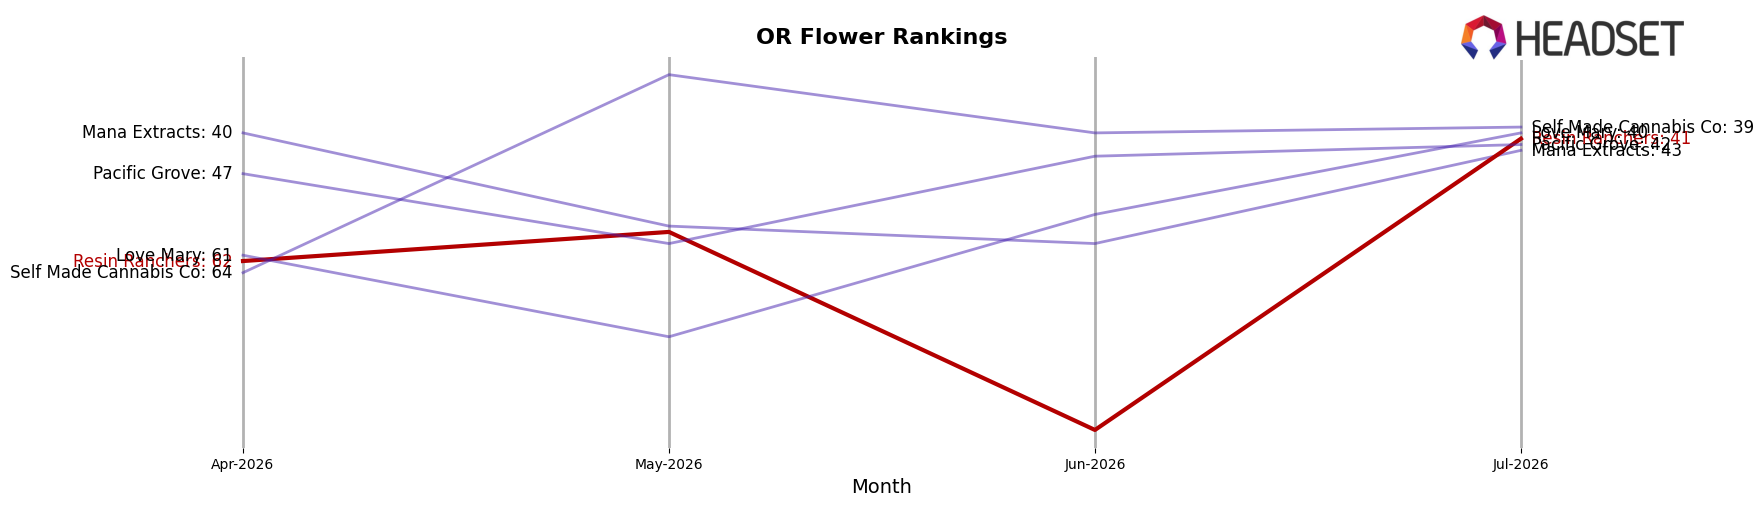
Resin Ranchers sits at rank #41 in OR Flower in July 2026 after climbing 77 positions year over year from #118, and it improved 21 spots versus April 2026 when it was #62; however, this is still eight positions below its peak rank of #33 from March 2025 and trails top-tier movement where PRUF Cultivar / PRŪF Cultivar held #1 both this year and last while Grown Rogue advanced from #3 to #2. Against this backdrop, with Otis Garden rising from #12 to #4 and Bald Peak slipping from #2 to #5 despite a -15.5% sales change, the combination of a 77-rank YoY gain and a 21-rank rebound since April 2026 indicates Resin Ranchers is transitioning from volatility toward mid-pack stability but still lacks the sustained acceleration seen at the top.
Notable Products
Kush Mintz (1g) posted the headline move in July 2026 with a 468.7% month-over-month jump to rank 4, while Mount Hood Magic Durban (Bulk) rose 71.9% to rank 2. Cap Junky (Bulk)) advanced 215.3% to rank 8 as GMO (1g) surged 152.0% to rank 10, indicating bulk and small-format SKUs both participated in the upswing. With all top-10 entries in Flower and four SKUs exceeding +100% MoM, the mix points to a strategy concentrating on Flower depth and rapid rotation within a few fast-rising strains, emphasizing velocity over breadth.
Top Selling Cannabis Brands






Data for this report comes from real-time sales reporting by participating cannabis retailers via their point-of-sale systems, which are linked up with Headset’s business intelligence software. Headset’s data is very reliable, as it comes digitally direct from our partner retailers. However, the potential does exist for misreporting in the instance of duplicates, incorrectly classified products, inaccurate entry of products into point-of-sale systems, or even simple human error at the point of purchase. Thus, there is a slight margin of error to consider. Brands listed on this page are ranked in the top twenty within the market and product category by total retail sales volume.

