.svg)
Aug-2026
Sales
Trend
6-Month
Product Count
SKUs
Avg Price
YoY Sales Change
YoY Price Change


Market Insights Snapshot
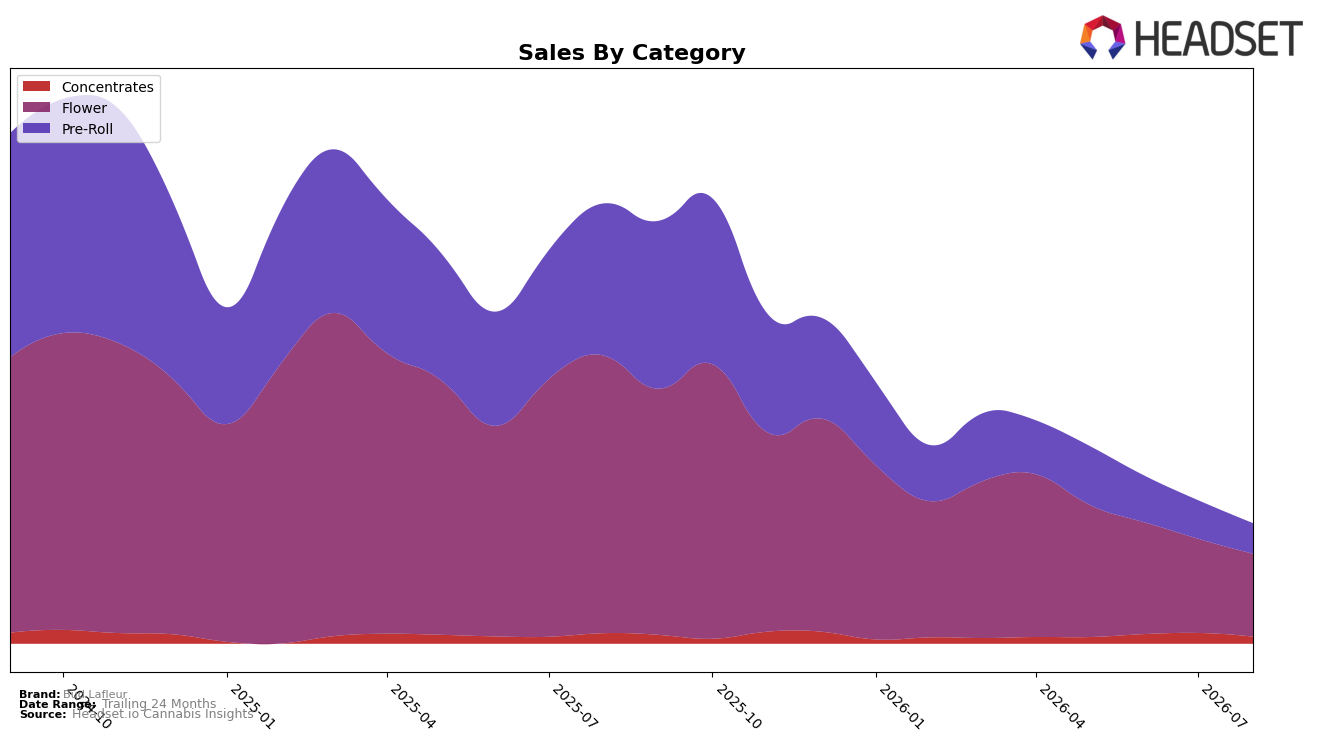
Bud Lafleur’s August 2026 mix leans heavily into Flower at 61.73% share with year-over-year contraction of 67.69% and month-over-month decline of 10.87%, while Pre-Roll holds 26.92% share with a steeper 75.04% YoY and 16.49% MoM drop; Concentrates, at 11.35% share, fell 16.97% YoY and 17.77% MoM. Average price moved down 3.59% YoY to $24.23, against category price points of $39.10 in Flower and $12.56 in Pre-Roll, and Bud Lafleur sits at rank 67 in Flower in Ontario. The pattern implies overexposure to high-variance inhalables where both Pre-Roll and Flower are compressing faster than Concentrates, suggesting the portfolio’s current weighting is amplifying topline volatility rather than buffering it.
The sharper 75.04% YoY decline in Pre-Roll versus 67.69% in Flower, paired with Concentrates contracting only 16.97% YoY despite a 17.77% MoM dip, indicates that incremental share shifted toward lower-elasticity niches could stabilize rank beyond position 67. With brand sales down 68.01% YoY and a 10.87% to 17.77% MoM slide range across categories in August 2026, the mix signals that maintaining a 61.73% Flower anchor while underweighting an 11.35% Concentrates contribution is misaligned with categories showing relatively smaller annual retracement, pointing to a tactical need to rebalance toward categories with slower YoY erosion to cushion month-to-month swings.
Competitive Landscape
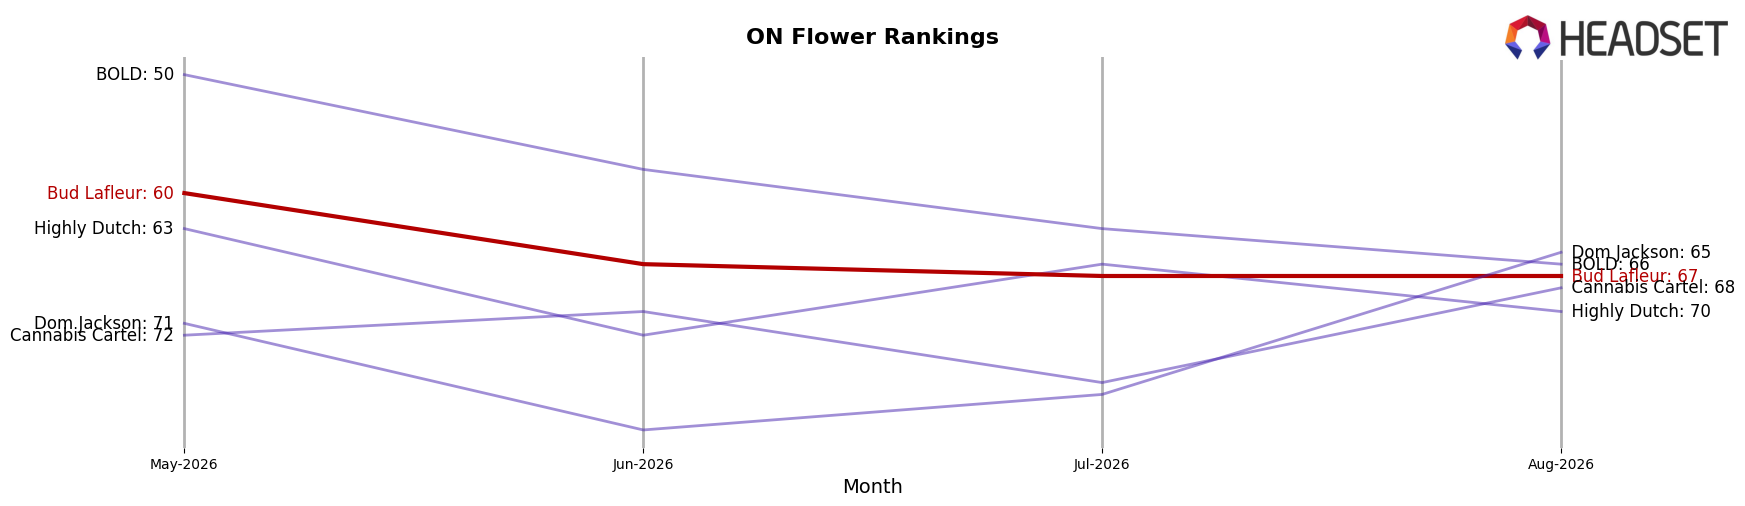
Bud Lafleur sits at rank #67 in ON Flower in August 2026, down 31 positions year over year from #36, and 7 positions below its May 2026 rank of #60; its historical peak was #32 in March 2025, placing the current slot 35 ranks off that high. Competitive pressure is acute at the top: Shred climbed from #2 to #1 with 18.96% year-over-year sales growth, while Spinach rose from #4 to #2 on 27.45% growth, indicating leaders are consolidating share as Bud Lafleur loses rank positions. This divergence—leaders advancing 1–2 ranks while Bud Lafleur declines 7 ranks since May 2026—implies a sustained share erosion pattern unless the brand reclaims distribution or mix that once supported its March 2025 peak.
Notable Products
Compac Crushers Pre-Roll 2-Pack (2g) posted a 52.9% month-over-month increase to rank 1, while Citroli Pre-Roll (1g) fell 22.3% to rank 2. Banana Daddy (3.5g) declined 28.5% at rank 7 and Dante'z Inferno (3.5g) slid 12.2% at rank 5. With four of the top ten coming from Pre-Roll, the category’s volatility is outpacing Flower and suggests the portfolio is tilting toward small-pack trial rather than sustained eighth-ounce throughput.
Strawberry Bubbles Black Hash (2g) dropped 21.8% at rank 4 as Flower mainstay Citroli (3.5g) eased just 1.4% at rank 3, indicating relative stability in flagship Flower against sharper declines in peripheral formats. Banana Daddy (14g) entered at rank 9 with $28,423 despite Banana Daddy (3.5g) contracting 28.5%, pointing to intra-strain trade-ups toward larger sizes. The pattern implies a barbell mix: premium or novelty Pre-Roll driving spikes at the top while value-oriented large-format Flower absorbs demand shifts within strains.
Top Selling Cannabis Brands






Data for this report comes from real-time sales reporting by participating cannabis retailers via their point-of-sale systems, which are linked up with Headset’s business intelligence software. Headset’s data is very reliable, as it comes digitally direct from our partner retailers. However, the potential does exist for misreporting in the instance of duplicates, incorrectly classified products, inaccurate entry of products into point-of-sale systems, or even simple human error at the point of purchase. Thus, there is a slight margin of error to consider. Brands listed on this page are ranked in the top twenty within the market and product category by total retail sales volume.

