.svg)
Aug-2026
Sales
Trend
6-Month
Product Count
SKUs
Avg Price
YoY Sales Change
YoY Price Change


Market Insights Snapshot
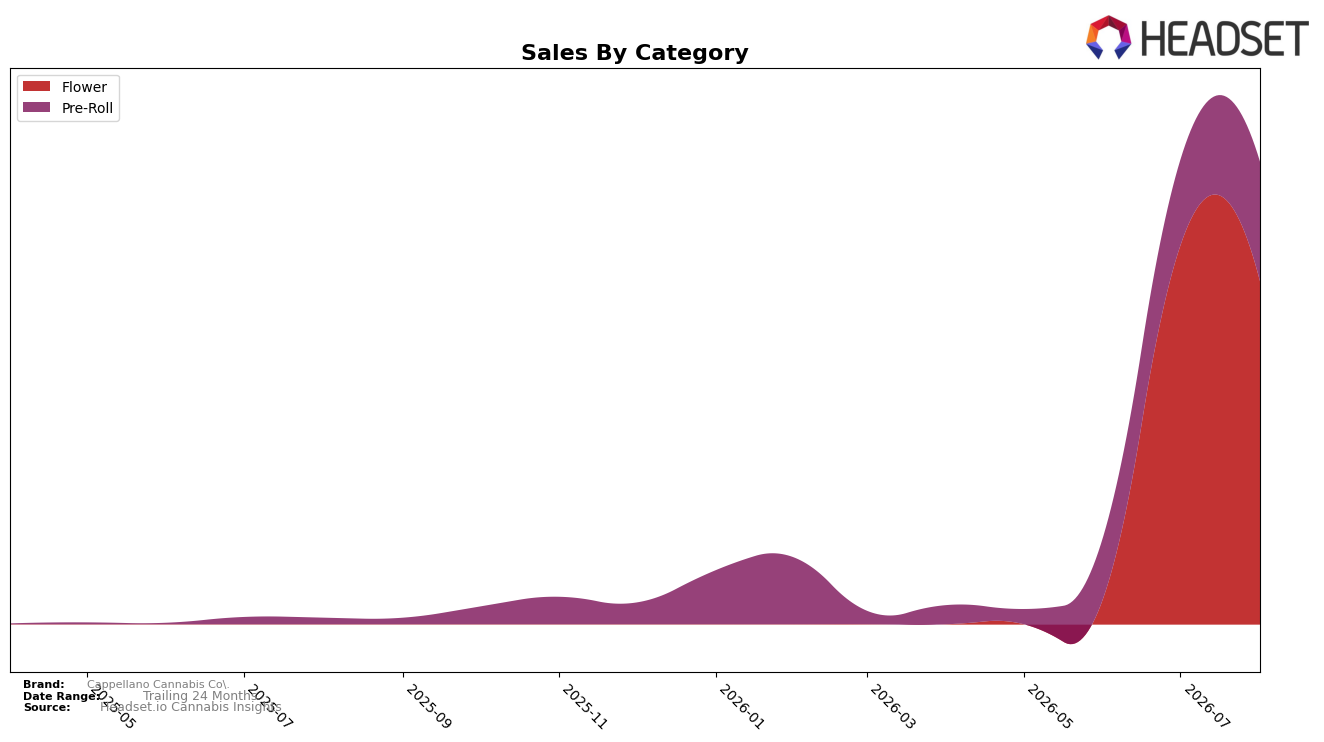
In August 2026, Cappellano Cannabis Co. concentrated 74.21% of sales in Flower while allocating 25.79% to Pre-Roll, marking a month-over-month split shaped by a 9.46% decline in Flower alongside a 39.51% rise in Pre-Roll. Within Pre-Roll, year-over-year sales surged 1,809.66% as average price held at $8.08, contrasting with Flower’s higher average price of $36.52 and no reported year-over-year rate, and the overall average price rose 360.41% year over year. Anchored in British Columbia with Flower ranked 46th, the mix implies a tactical pivot toward value-driven volume in Pre-Roll while Flower serves as the premium-priced anchor.
The shift toward Pre-Roll’s 39.51% month-over-month growth alongside Flower’s 9.46% decline suggests Cappellano Cannabis Co. is using lower-priced formats to expand reach while protecting a high-price-point halo in Flower. Given 1,809.66% year-over-year expansion in Pre-Roll against a 360.41% brand-level average price increase, the portfolio appears to be balancing unit acquisition in accessible formats with margin capture in premium Flower, positioning the brand to climb from a 46th rank in British Columbia Flower by leveraging cross-category price tiers.
Competitive Landscape
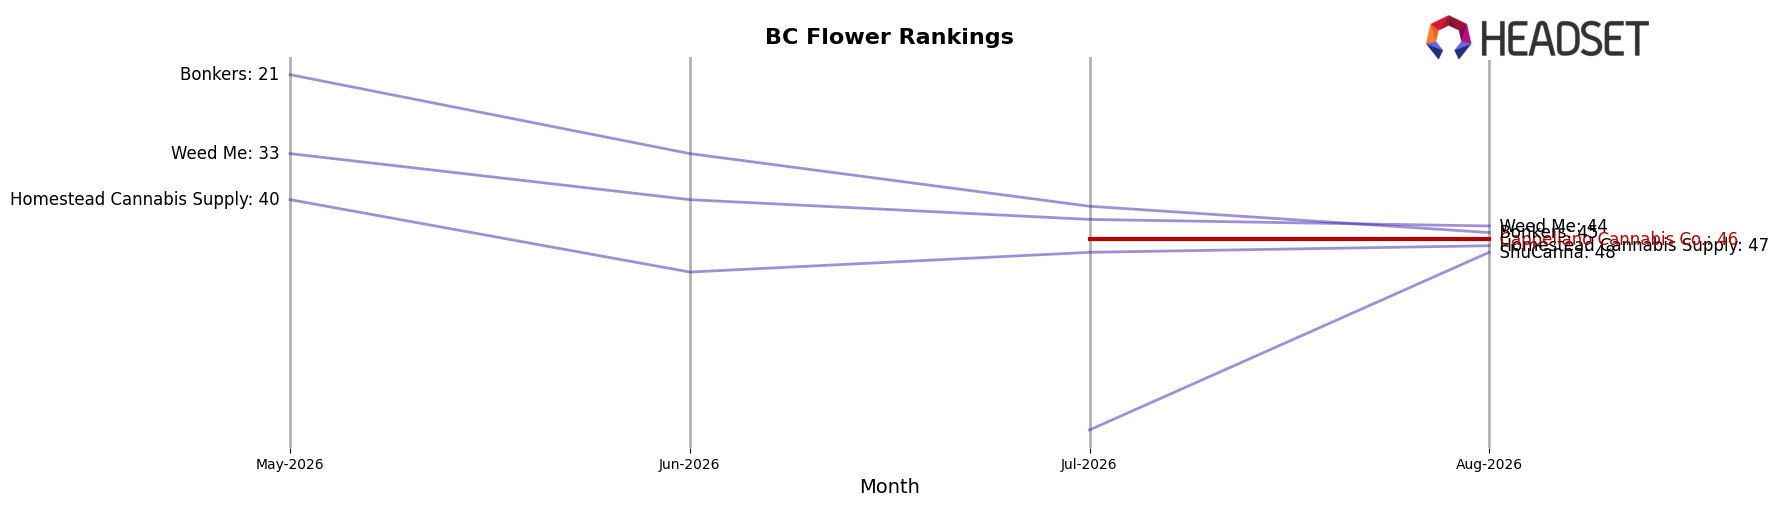
Cappellano Cannabis Co. is ranked #46 in BC Flower in August 2026, with year-over-year rank change unavailable, while category leaders moved up materially: Big Bag O' Buds held #1 with 33.8% YoY sales growth and Spinach climbed to #2 from #4 as sales rose 54.2%; meanwhile, Good Supply advanced to #3 from #6 with 91.8% YoY growth and Bake Sale sits at #5 from #3 despite only 2.1% YoY growth. With Cappellano Cannabis Co. peaking at its current #46 in August 2026 while competitors consolidate at ranks #1–#5, the pattern implies a need for step-change share capture since flat or unreported rank momentum against double-digit competitor gains points to widening distance from the top tier.
Notable Products
Cherry Fritter Pre-Roll (0.5g) delivered the standout move in August 2026 with a +482% month-over-month surge to $10,389 and jumped to rank 1, while Maple Blizzard Pre-Roll (0.5g) fell -64% and slid to rank 9. Glacier Fruit Pre-Roll (0.5g) was essentially flat at -0.24% yet held rank 2, and Organic Glacier Fruit (3.5g) dropped -25% to rank 3, indicating share is rotating toward Pre-Rolls at the very top of the chart. With five of the top ten SKUs in Pre-Rolls, the mix points to a pivot toward ready-to-use formats and away from larger Flower packs that are posting negative momentum.
Top Selling Cannabis Brands






Data for this report comes from real-time sales reporting by participating cannabis retailers via their point-of-sale systems, which are linked up with Headset’s business intelligence software. Headset’s data is very reliable, as it comes digitally direct from our partner retailers. However, the potential does exist for misreporting in the instance of duplicates, incorrectly classified products, inaccurate entry of products into point-of-sale systems, or even simple human error at the point of purchase. Thus, there is a slight margin of error to consider. Brands listed on this page are ranked in the top twenty within the market and product category by total retail sales volume.

