.svg)
Aug-2026
Sales
Trend
6-Month
Product Count
SKUs
Avg Price
YoY Sales Change
YoY Price Change


Market Insights Snapshot
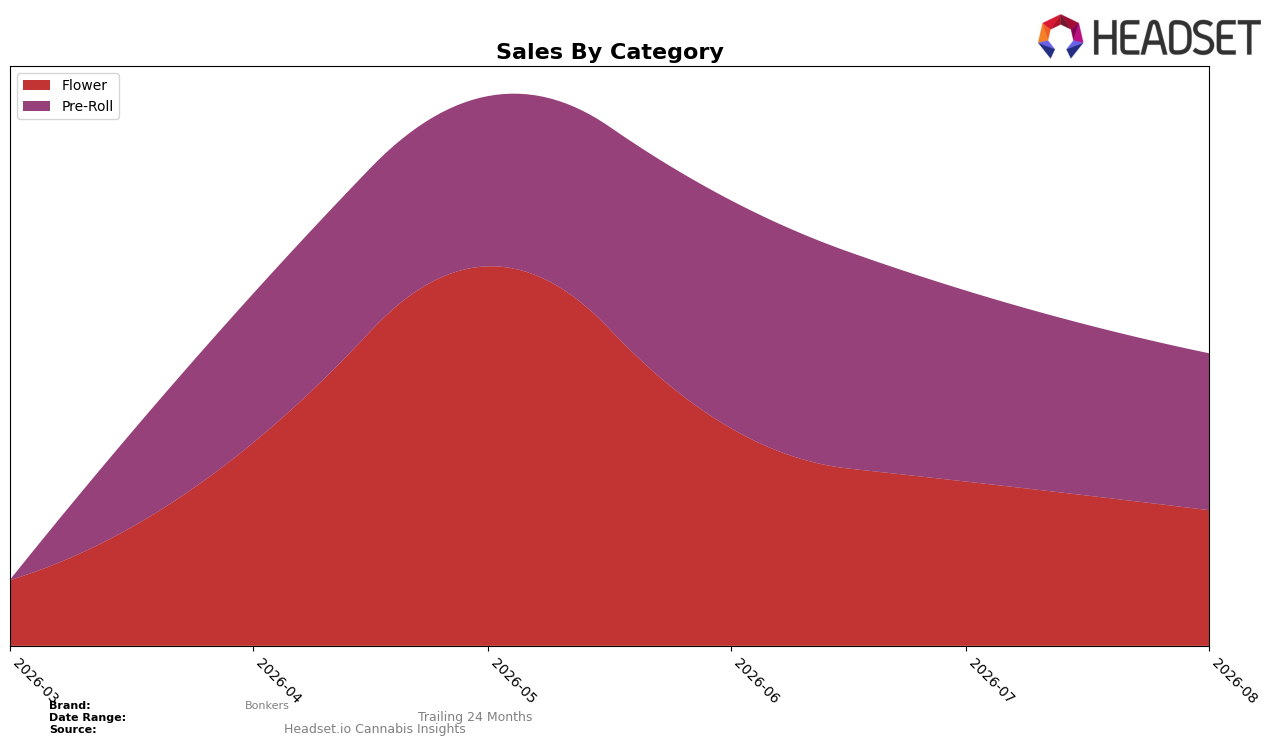
In August 2026, Bonkers concentrated sales in Pre-Roll at 53.54% share while Flower accounted for 46.46%, with Pre-Roll average price at $41.19 and Flower at $108.11. Month over month, Pre-Roll declined by 17.44% and Flower fell by 17.00%, and Bonkers held rank 54 in Pre-Roll within British Columbia. The mix skews barely toward Pre-Roll despite parallel MoM contractions in both categories, implying the category balance is being set more by relative price tiers and velocity than by short-term demand shocks.
The near-equal split — 53.54% Pre-Roll versus 46.46% Flower — combined with a 0.44 percentage-point smaller MoM drop in Flower (17.00% vs. 17.44%) points to incremental resilience in higher-ticket items even as overall volume cools. With a Pre-Roll rank of 54 in British Columbia and a portfolio price spread of 162% between category averages ($108.11 vs. $41.19), the positioning hinges on managing trade-down risk: maintaining Pre-Roll velocity while protecting Flower margin mix should prevent further share erosion if another 10–20% MoM swing materializes.
Competitive Landscape
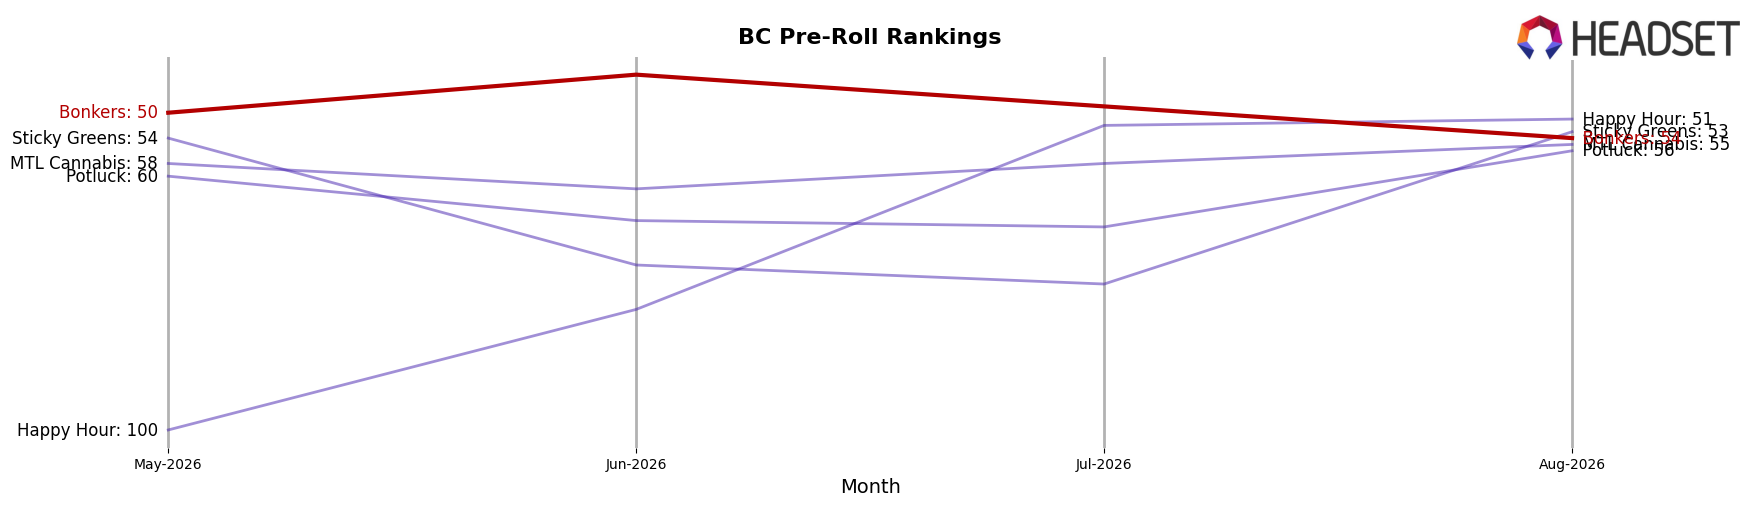
Bonkers sits at rank #54 in BC Pre-Roll in August 2026, slipping 4 positions from #50 in May 2026 while remaining 10 places below its June 2026 peak at #44; against this movement, Back Forty / Back 40 Cannabis climbed from #17 year over year to #1 and expanded sales by 237.7%, and General Admission edged up 1 place to #2 despite a 10.7% sales contraction—indicating Bonkers is losing relative rank share as faster-moving leaders consolidate the top tier and that its mid-year peak did not convert into sustained placement.
Notable Products
Orange Push Pop Resin Infused Blunt (1g) posted the steepest drop in August 2026 at -75.7% while sliding to rank 5, whereas Dream Catcher Pre-Roll 14-Pack (7g) fell -33.0% at rank 2, indicating instability concentrated in smaller pre-roll formats. Purple Lemonade Pre-Roll 14-Pack (7g) in rank 1 inched up +3.1% while Purple Lemonade (14g) at rank 3 declined -29.1%, and with three of the top five in Pre-Roll, the mix is tilting toward format convenience despite volatility within infused SKUs. Dream Catcher (28g) held near flat at -0.9% in rank 4 while Bubblegum Sherb (14g) dipped -1.4% at rank 6, suggesting flower is steady but ceding rank to pre-roll leaders. The pattern implies Bonkers is consolidating around high-volume pre-roll flagships while pruning or re-pricing underperforming niche variants, pointing commercial focus toward scalable pre-roll lines over bulk flower.
Top Selling Cannabis Brands






Data for this report comes from real-time sales reporting by participating cannabis retailers via their point-of-sale systems, which are linked up with Headset’s business intelligence software. Headset’s data is very reliable, as it comes digitally direct from our partner retailers. However, the potential does exist for misreporting in the instance of duplicates, incorrectly classified products, inaccurate entry of products into point-of-sale systems, or even simple human error at the point of purchase. Thus, there is a slight margin of error to consider. Brands listed on this page are ranked in the top twenty within the market and product category by total retail sales volume.

