.svg)

Aug-2026
Sales
Trend
6-Month
Product Count
SKUs
Avg Price
YoY Sales Change
YoY Price Change


Market Insights Snapshot
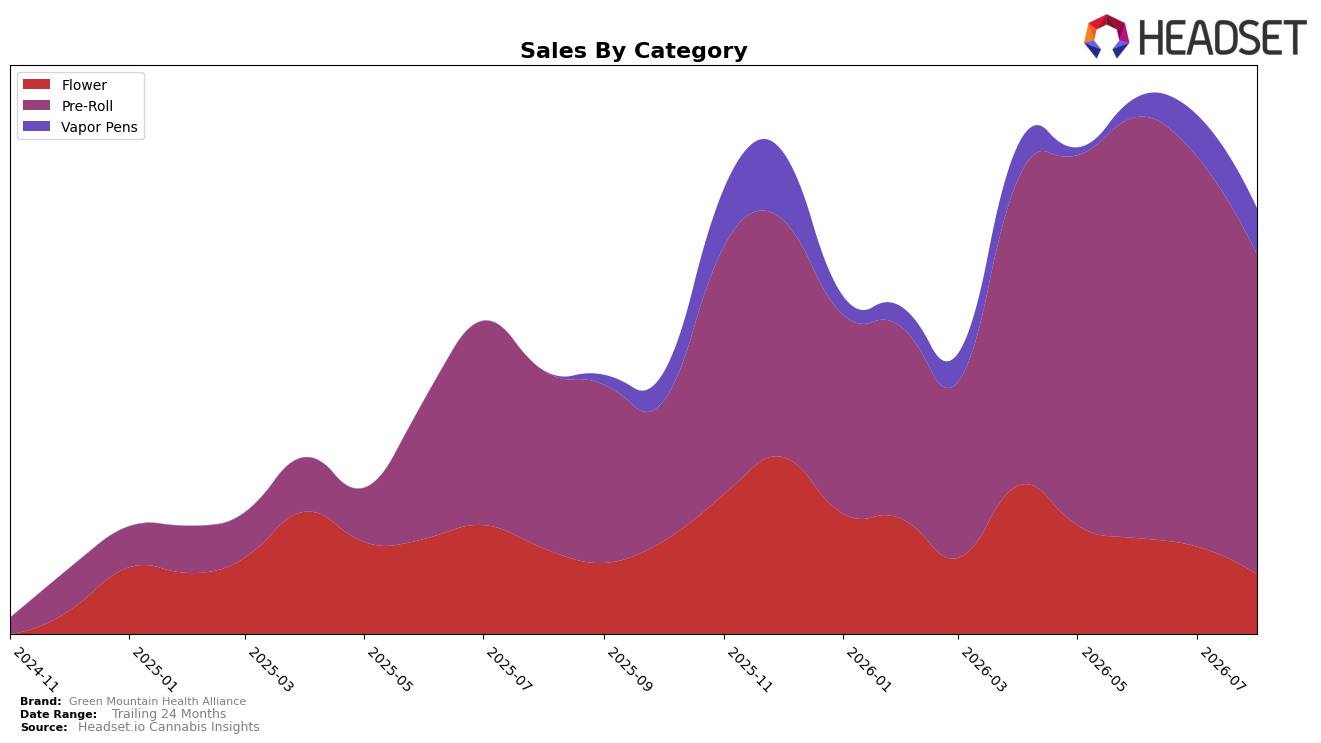
In August 2026, Green Mountain Health Alliance concentrated 75.17% of sales in Pre-Roll, where category sales grew 79.93% year over year but fell 18.22% month over month, while Flower dropped to a 14.04% share with a 30.30% YoY decline and a 31.79% MoM decline. Vapor Pens held 10.80% share with a 10.94% MoM increase and no year-ago comp, coinciding with a brand-level average price up 0.40% YoY and an overall brand sales lift of 61.51% YoY; the brand’s Pre-Roll rank was 38 in British Columbia, signaling growth concentrated in a single category but with recent monthly volatility that could compress the lead mix if the MoM pullback continues.
The mix shift implies dependence on Pre-Roll scale to carry overall gains despite August 2026 MoM softness of 18.22% in that anchor category and a concurrent 31.79% MoM decline in Flower, while Vapor Pens’ 10.94% MoM rise offers a smaller but growing hedge. With Pre-Roll up 79.93% YoY yet ranked 38 in British Columbia and Flower down 30.30% YoY, the pattern points to a need for balance: defending Pre-Roll share above 75% while accelerating Vapor Pens to offset Flower contraction could improve rank stability and reduce month-to-month swings.
Competitive Landscape
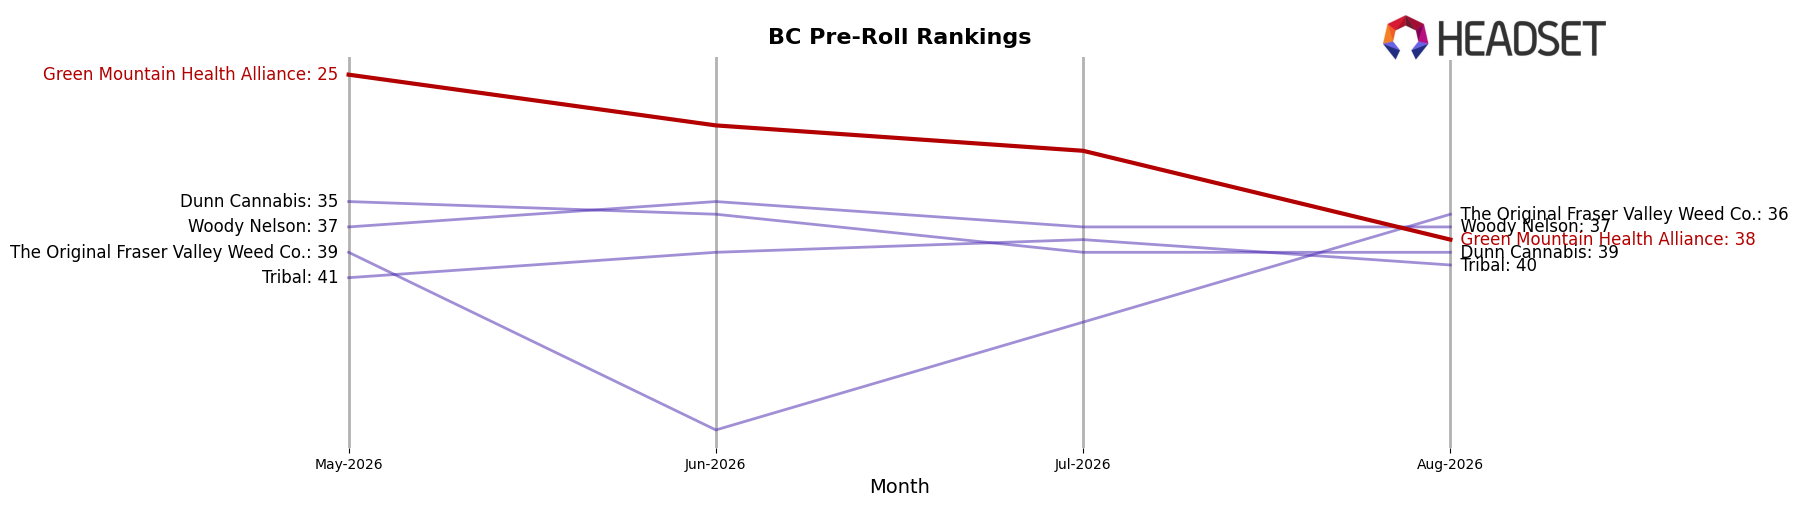
Green Mountain Health Alliance sits at rank #38 in BC Pre-Roll for August 2026, improving 4 spots from #42 year over year but dropping 13 places from #25 in May 2026, indicating mixed momentum; meanwhile, category leaders moved sharply as Back Forty / Back 40 Cannabis climbed from #17 to #1 with 237.7% YoY sales growth and General Admission slipped from #1 to #2 with a 10.7% YoY sales decline, tightening the top tier. Compared with its peak at #18 in October 2025, the current #38 position represents a 20-rank slide despite a 4-rank YoY gain, while peers like Good Supply advanced from #7 to #5 on 47.3% YoY growth; this gap implies Green Mountain Health Alliance’s rank trajectory is stabilizing year over year but ceding share to faster-rising competitors, signaling a need to re-accelerate before the October 2025 peak window becomes a ceiling rather than a waypoint.
Notable Products
Cherry Purple Punch Pre-Roll 3-Pack (1.5g) posted the steepest movement in August 2026, dropping 55.7% MoM and sliding to rank 4, while Gorilla Zkittlez Pre-Roll 2-Pack (2g) fell 10.8% MoM at rank 1. Gas Pedal (28g) declined 30.1% MoM at rank 9, contrasting with Forbidden Fruit Live Resin Disposable (1g) up 15.8% MoM at rank 6, and at least seven of the top ten are Pre-Roll SKUs concentrated in a single category. The prevalence of negative MoM shifts across Pre-Rolls and a relative lift in Vapor Pens implies the product mix is tilting away from multi-pack Pre-Rolls toward diversified form factors.
Top Selling Cannabis Brands






Data for this report comes from real-time sales reporting by participating cannabis retailers via their point-of-sale systems, which are linked up with Headset’s business intelligence software. Headset’s data is very reliable, as it comes digitally direct from our partner retailers. However, the potential does exist for misreporting in the instance of duplicates, incorrectly classified products, inaccurate entry of products into point-of-sale systems, or even simple human error at the point of purchase. Thus, there is a slight margin of error to consider. Brands listed on this page are ranked in the top twenty within the market and product category by total retail sales volume.

