.svg)

Aug-2026
Sales
Trend
6-Month
Product Count
SKUs
Avg Price
YoY Sales Change
YoY Price Change


Market Insights Snapshot
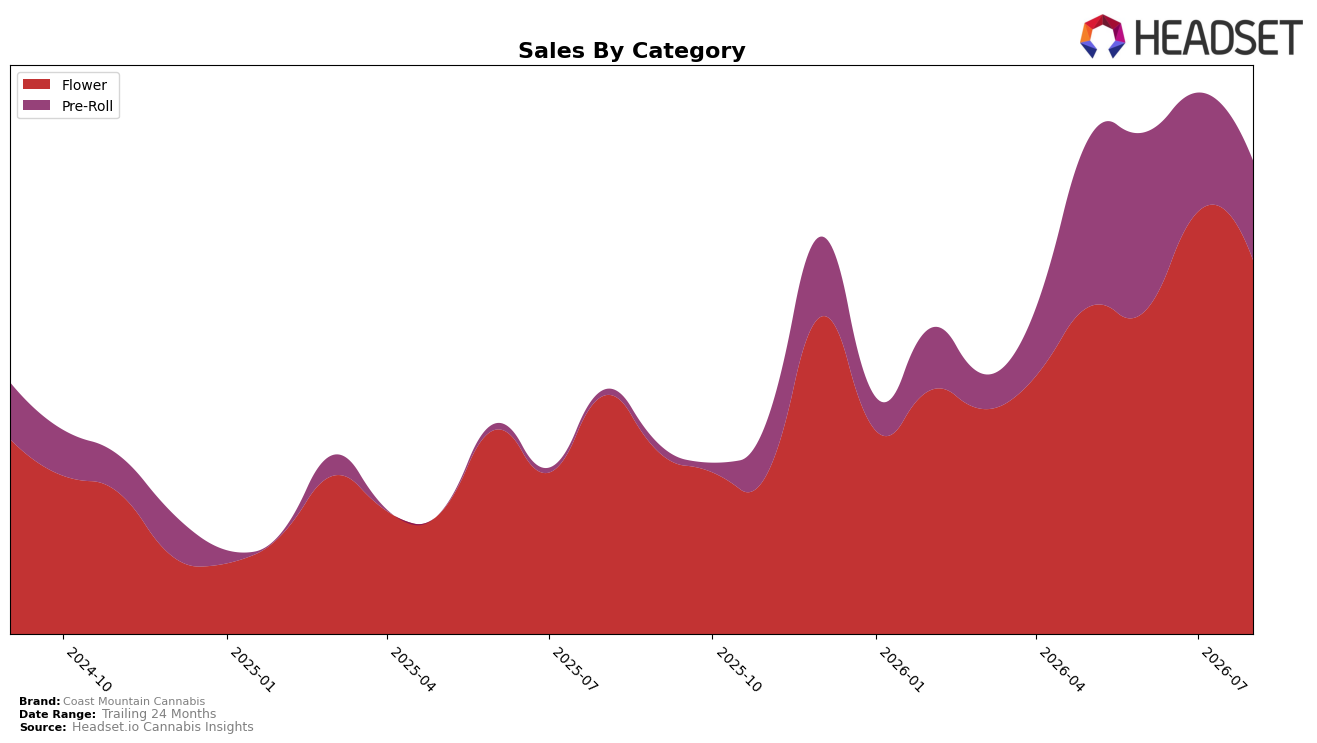
In August 2026, Coast Mountain Cannabis concentrated 78.97% of sales in Flower and 21.03% in Pre-Roll, with Flower up 56.81% year over year but down 11.48% month over month, while Pre-Roll surged 1,547.69% year over year and fell 16.44% month over month. Despite an 11.92% year-over-year decline in average price, brand-level sales grew 93.66% year over year, indicating mix and volume gains outweighed pricing pressure. Within British Columbia, a rank of 34 in Flower alongside a 78.97% mix share and a 56.81% category YoY increase implies the brand’s scale still hinges on Flower even as Pre-Roll expands rapidly.
The shift toward a 21.03% Pre-Roll share, combined with a 1,547.69% year-over-year surge and a 16.44% month-over-month pullback, suggests trial-heavy growth that may be sensitive to short-cycle resets, while the 11.48% month-over-month decline in Flower indicates exposure to seasonal or inventory timing effects. With average price down 11.92% year over year and Flower’s average price at $65.05 versus Pre-Roll at $17.76, the brand is trading mix toward lower price points even as total sales rose 93.66% year over year, implying a positioning pivot toward accessible formats that can widen reach but may dilute premium price signaling; combined with a 34 rank in British Columbia Flower, the pattern points to prioritizing volume-led gains before premium rank advancement.
Competitive Landscape
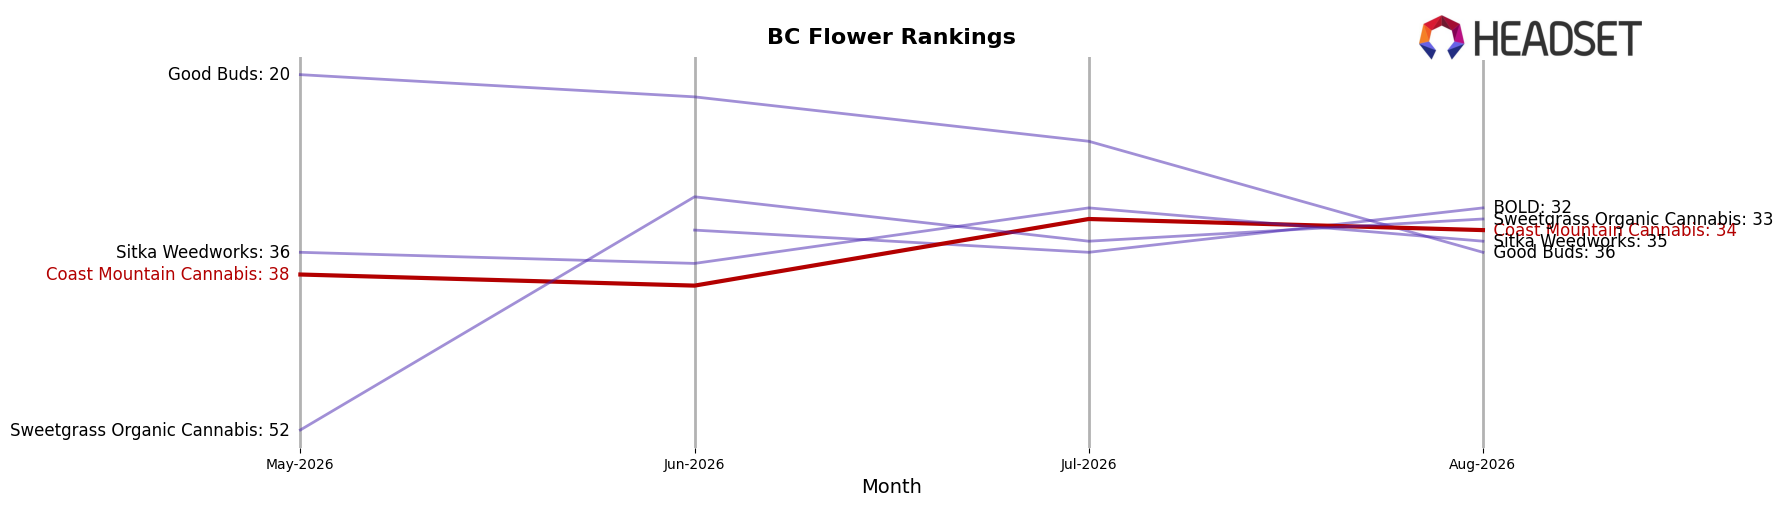
Coast Mountain Cannabis ranks #34 in BC Flower in August 2026, improving 12 positions year over year from #46 while slipping 1 spot from its July 2026 peak of #33; over the last three months it moved up 4 spots from #38 to #34, whereas Spinach advanced from #4 to #2 and Good Supply climbed from #6 to #3 with 54% and 92% year-over-year sales gains respectively, indicating Coast Mountain Cannabis is regaining rank but ceding momentum to faster-rising leaders, which implies a stabilization phase rather than a breakout trajectory absent a sharper share or rank inflection.
Notable Products
Lucy In The Sky Pre-Roll 3-Pack (1.5g) posted the steepest movement in August 2026 with a -71.0% month-over-month decline and slid to rank 8, while BC Organic - Bling Blaow Pre-Roll 3-Pack (1.5g) rose 35.2% MoM to hold rank 1. Within Flower, Lilac Diesel (3.5g) fell -44.4% MoM despite the larger-format Lilac Diesel (14g) growing 10.4% MoM at rank 4, and Pure Cake Skunk (14g) contracted -19.8% at rank 5. Four of the top ten are Flower SKUs and four are Pre-Rolls, but the divergence between formats and pack sizes indicates demand is consolidating around premium Pre-Roll leaders while select large-format Flower retains share at the expense of smaller sizes.
Top Selling Cannabis Brands






Data for this report comes from real-time sales reporting by participating cannabis retailers via their point-of-sale systems, which are linked up with Headset’s business intelligence software. Headset’s data is very reliable, as it comes digitally direct from our partner retailers. However, the potential does exist for misreporting in the instance of duplicates, incorrectly classified products, inaccurate entry of products into point-of-sale systems, or even simple human error at the point of purchase. Thus, there is a slight margin of error to consider. Brands listed on this page are ranked in the top twenty within the market and product category by total retail sales volume.

