.svg)
Aug-2026
Sales
Trend
6-Month
Product Count
SKUs
Avg Price
YoY Sales Change
YoY Price Change


Market Insights Snapshot
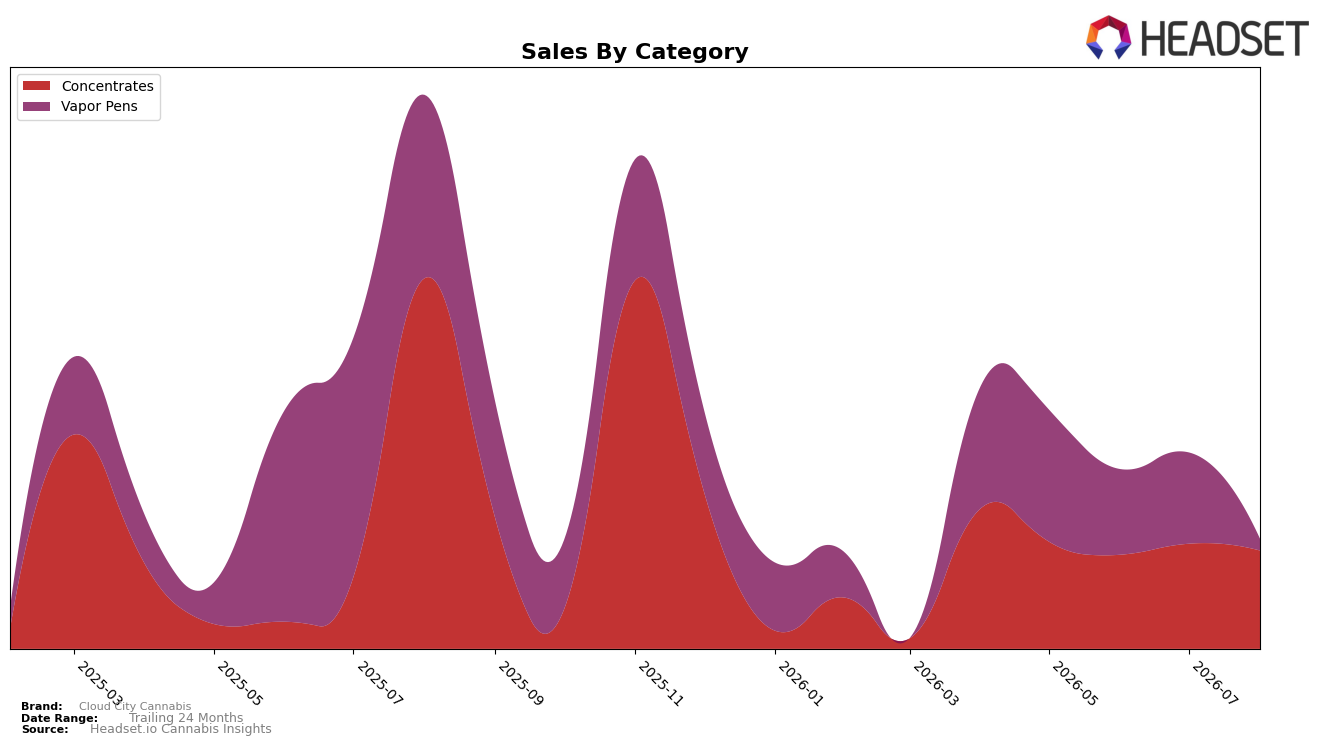
In August 2026, Cloud City Cannabis concentrated 89.50% of sales in Concentrates, with Vapor Pens at 10.50%, indicating a sharper tilt toward a single category than earlier in the year. Year over year, Concentrates declined 73.54% while Vapor Pens fell 93.73%, and month over month the split widened further with Concentrates down 6.54% versus an 87.35% contraction in Vapor Pens. The brand’s average price dropped 13.34% YoY to $47.02, diverging by category as Concentrates averaged $46.24 and Vapor Pens $54.95, implying the volume base is increasingly anchored in lower-priced Concentrates while premium-priced Vapor Pens are retreating faster. The pattern implies Cloud City Cannabis is consolidating around Concentrates as its functional core while Vapor Pens retreat to a residual role.
The mix shift implies a positioning recalibration: with 89.50% share in Concentrates and only 10.50% in Vapor Pens, Cloud City Cannabis is effectively competing on depth within Concentrates rather than breadth across inhalable formats. The asymmetric declines — 73.54% YoY and 6.54% MoM in Concentrates versus 93.73% YoY and 87.35% MoM in Vapor Pens — suggest resource allocation away from Vapor Pens would reduce volatility and align pricing moves to defend the Concentrates base. Given British Columbia context and a null Vapor Pens rank, the brand’s near-term positioning hinges on reinforcing price-to-value in Concentrates while treating Vapor Pens as opportunistic rather than foundational.
Competitive Landscape
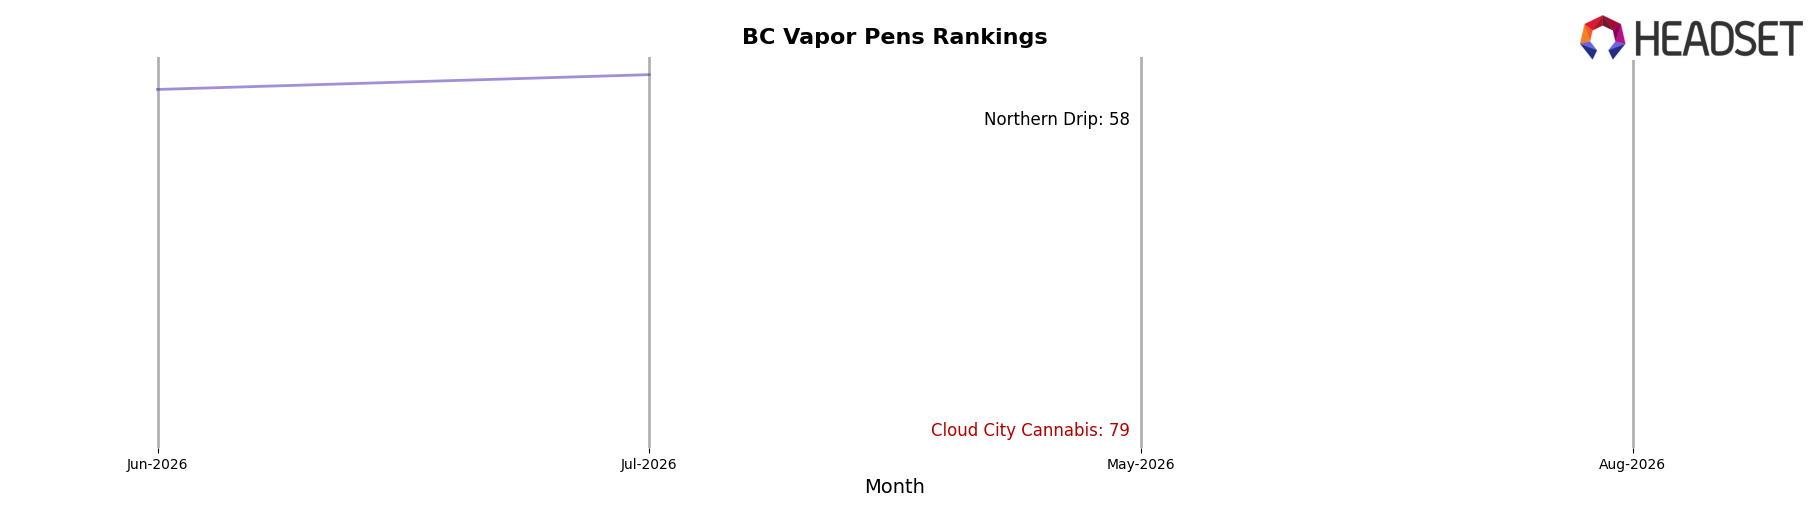
Cloud City Cannabis sits at rank #95 in BC Vapor Pens in August 2026, sliding 36 places year over year from #59, and falling 16 positions since May 2026 when it was #79; against a category where Spinach climbed from #3 to #1 with 242.2% YoY sales growth and BoxHot edged from #1 to #2 with 15.4% YoY growth, Cloud City Cannabis has moved away from its peak of #57 in June 2025 and now ranks 92 places below the leader. With General Admission improving from #2 to #3 and Back Forty / Back 40 Cannabis rising from #7 to #5 alongside 76.5% YoY growth, the widening rank gap implies Cloud City Cannabis is losing relative velocity in distribution or repeat adoption, and the current trajectory points to further share erosion unless mix or channel coverage is recalibrated.
Notable Products
Hybrid Blend Live Rosin Cartridge (1g) posted the steepest decline at -87.4% MoM, dropping to rank 2 after previously outperforming, while 2026 Executive Blend Live Rosin (1g) climbed with a +40.0% MoM increase to rank 1. With Concentrates holding the top slot and Vapor Pens retreating sharply, the category mix tilts back toward solventless concentrates even as only one SKU accounts for the majority of sales, including approximately $7,925 in August 2026. The absence of Mango Mac Live Rosin (1g) from the rankings alongside a single Concentrates leader and a collapsing Vapor Pens SKU implies Cloud City Cannabis is consolidating around a flagship rosin play while de-emphasizing cartridges.
Top Selling Cannabis Brands






Data for this report comes from real-time sales reporting by participating cannabis retailers via their point-of-sale systems, which are linked up with Headset’s business intelligence software. Headset’s data is very reliable, as it comes digitally direct from our partner retailers. However, the potential does exist for misreporting in the instance of duplicates, incorrectly classified products, inaccurate entry of products into point-of-sale systems, or even simple human error at the point of purchase. Thus, there is a slight margin of error to consider. Brands listed on this page are ranked in the top twenty within the market and product category by total retail sales volume.

