.svg)


Where to Buy
Cycling Frog is stocked at 119 licensed dispensaries across New York, Minnesota, and 2 other states, 104 of them in New York, with the deepest coverage in New York, Rochester, Syracuse, Depew, and Queens. Search by ZIP code or city below to find the closest one, or filter by product type if you are after a specific format.
Market Insights Snapshot
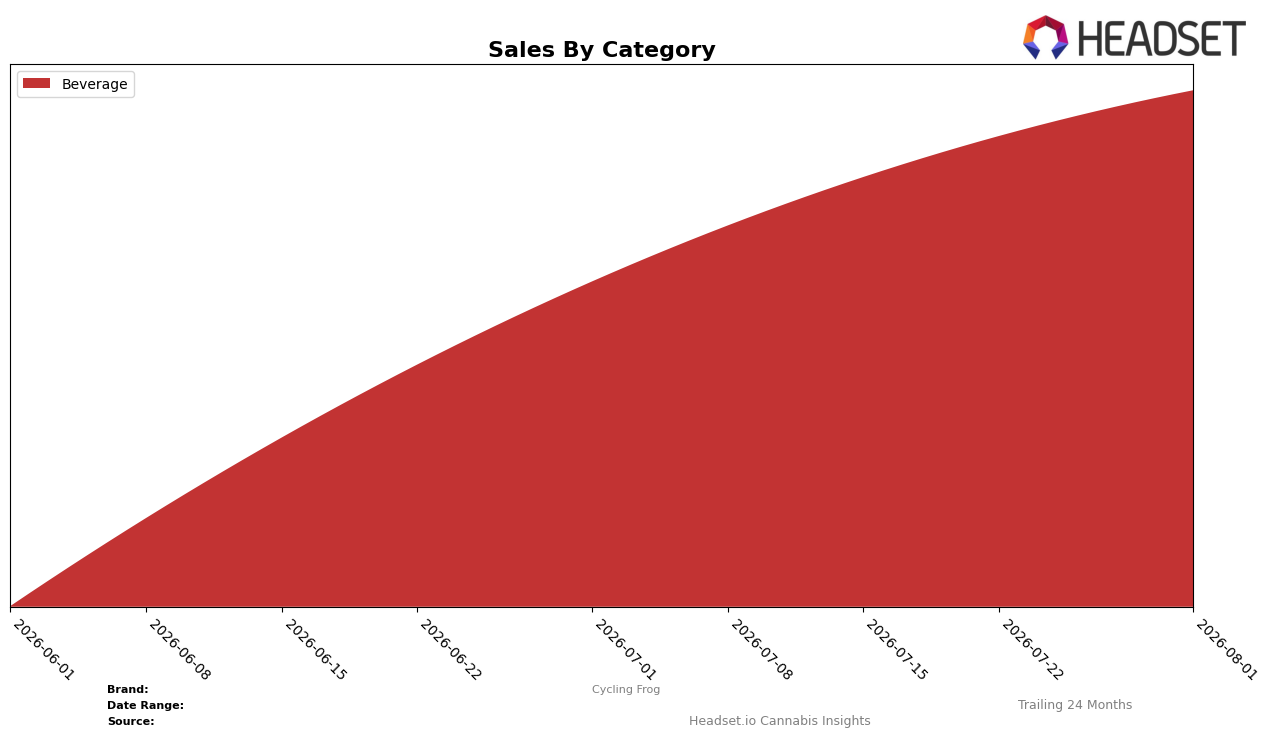
In August 2026, Cycling Frog operated as a single-category brand with Beverage accounting for 100.0% of sales, while month-over-month Beverage sales expanded by 58.7% and the brand held rank 6 in Beverage within New York. The absence of a reported year-over-year rate alongside a 58.7% month-over-month lift suggests a recent acceleration concentrated entirely in Beverage, implying category breadth stayed flat even as velocity climbed.
The consolidation at 100.0% Beverage share combined with a rank of 6 in New York signals a positioning anchored in ready-to-drink efficiency rather than portfolio diversification, with the 58.7% month-over-month gain pointing to episodic demand or distribution expansion rather than steady multi-category pull. This pattern implies the brand’s competitive posture will hinge on sustaining Beverage momentum and price pack architecture at an average price of $4.49, while the lack of year-over-year benchmarking and single-category exposure raise sensitivity to category-specific swings.
Competitive Landscape
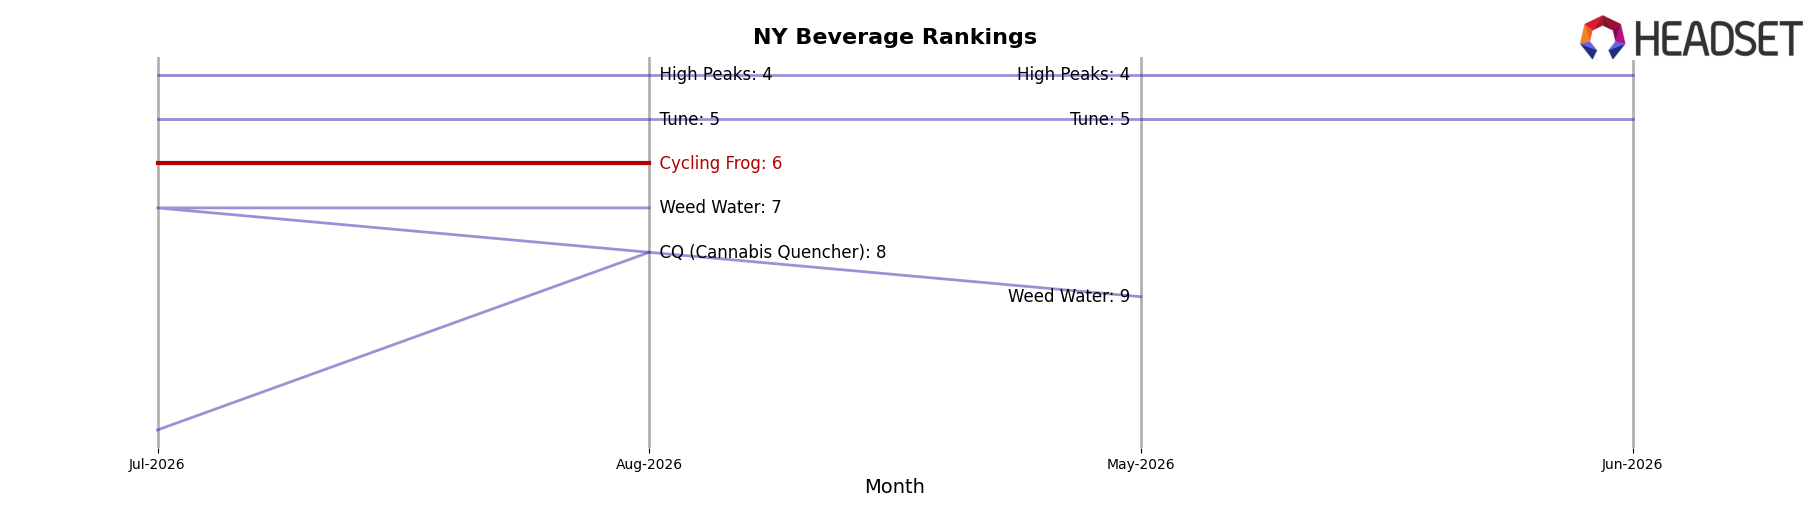
Cycling Frog is ranked #6 in NY Beverage in August 2026, with no recorded year-over-year rank baseline, and it reached a peak rank of #6 also in August 2026, which positions it below peers that either held or advanced: Ayrloom held #1 year-over-year despite a -9.6% sales change, while Harney Brothers Cannabis climbed from #5 to #3 alongside a 266.4% sales increase; further, Layup maintained #2 with an 86.7% sales lift as Tune slipped from #3 to #5 with a -15.0% decline, indicating that Cycling Frog’s flat entrance at #6 amid both upward and downward competitor movements implies a late-stage arrival or stalled share capture rather than momentum into the top five.
Notable Products
CBD/THC 1:2 Black Currant Seltzer (5mg CBD, 10mg THC, 12oz, 355ml) delivered the sharpest surge at +427.3% MoM while ranking 8, outpacing the +192.2% jump of CBD/THC 1:1 Black Currant Seltzer (10mg CBD, 10mg THC, 12oz, 355ml) at rank 4. CBD/THC 1:1 Ruby Grapefruit Seltzer (10mg CBD, 10mg THC, 12oz, 355ml) climbed +162.8% to rank 3 as CBD/THC 1:1 Cran Raspberry Seltzer (10mg CBD, 10mg THC, 12oz) held rank 1 with +11.5%, and the 2:1 Wild Cherry fell -16.2% at rank 5. With eight of the top ten SKUs in Beverage and 1:1 variants holding ranks 1-4 while mixed 1:2 formats post triple-digit gains, the pattern implies Cycling Frog is consolidating share around 1:1 leaders while successfully trialing higher-THC line extensions that can ladder into the top tier.
Top Selling Cannabis Brands






Data for this report comes from real-time sales reporting by participating cannabis retailers via their point-of-sale systems, which are linked up with Headset’s business intelligence software. Headset’s data is very reliable, as it comes digitally direct from our partner retailers. However, the potential does exist for misreporting in the instance of duplicates, incorrectly classified products, inaccurate entry of products into point-of-sale systems, or even simple human error at the point of purchase. Thus, there is a slight margin of error to consider. Brands listed on this page are ranked in the top twenty within the market and product category by total retail sales volume.

