


Is this your brand?
See your full sales and distribution data: where you sell, how you're priced, and how you rank against the brands next to you on the shelf.
See your brand's dataCarry this brand in your store?
Headset Retailer is free. Connect your POS and see what's selling and what's sitting.
Sign up freeWhere to Buy
Stereo Flower is stocked at 34 licensed dispensaries across California and New Jersey, 21 of them in California, with the deepest coverage in Antioch, Banning, Chula Vista, Coachella, and Corona. Search by ZIP code or city below to find the closest one, or filter by product type if you are after a specific format.
Market Insights Snapshot
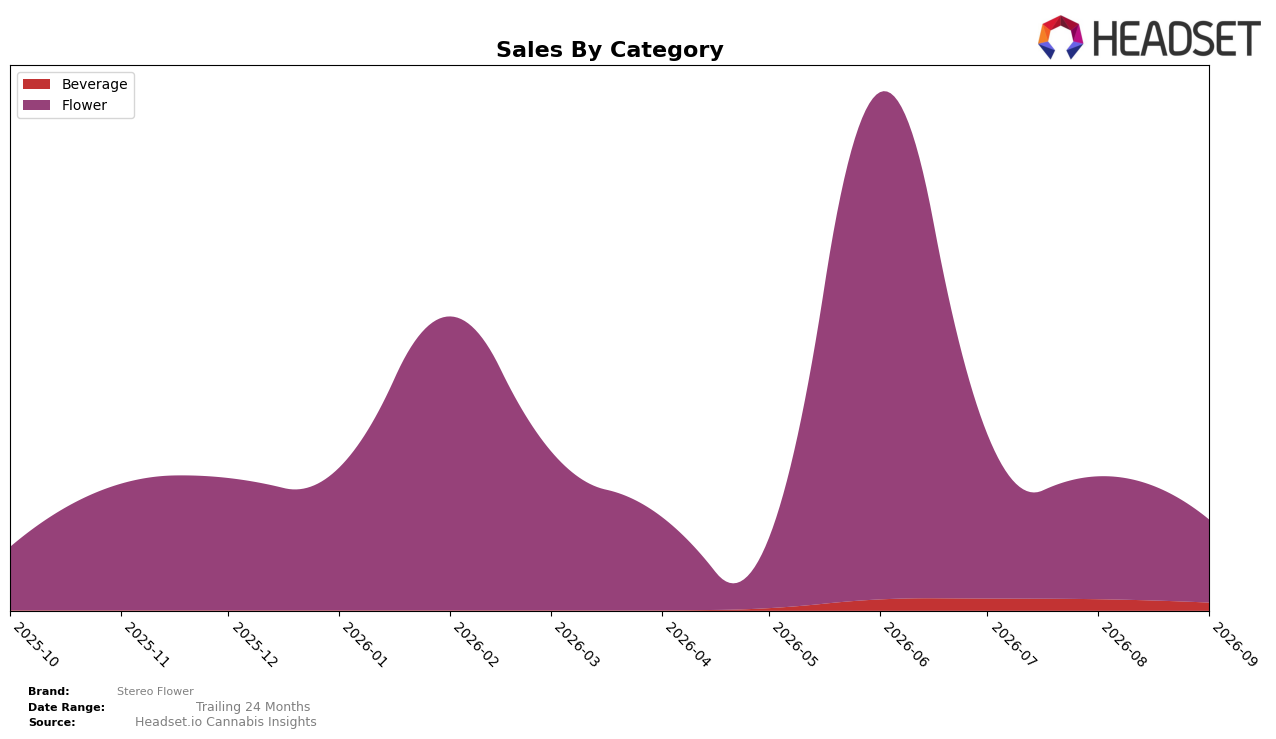
In September 2026, Stereo Flower’s category mix concentrated 91.40% of sales in Flower and 8.60% in Beverage, with Flower’s month-over-month decline of 32.68% only slightly steeper than Beverage’s 30.30% slide. Average price diverged by category at $9.95 for Flower versus $4.96 for Beverage, while overall brand average price sat at $9.16, implying a mix pull toward lower-priced units within Flower as its share held above 90%. With Flower holding the top-category position and no rank reported in California for Flower, the pattern points to a defensive mix concentration where volume compression is broad-based across categories but stabilized by a high-share flagship segment.
The simultaneous 32.68% month-over-month contraction in Flower and 30.30% in Beverage, alongside an enduring 91.40% Flower share, implies Stereo Flower is anchored to a single-category identity that magnifies exposure to Flower-specific demand swings. Given the $9.95 Flower price versus the $9.16 brand average, the mix skew suggests downtrading within Flower rather than redistribution into Beverage’s 8.60% share, indicating positioning as a value-leaning Flower specialist rather than a cross-category basket builder.
Competitive Landscape
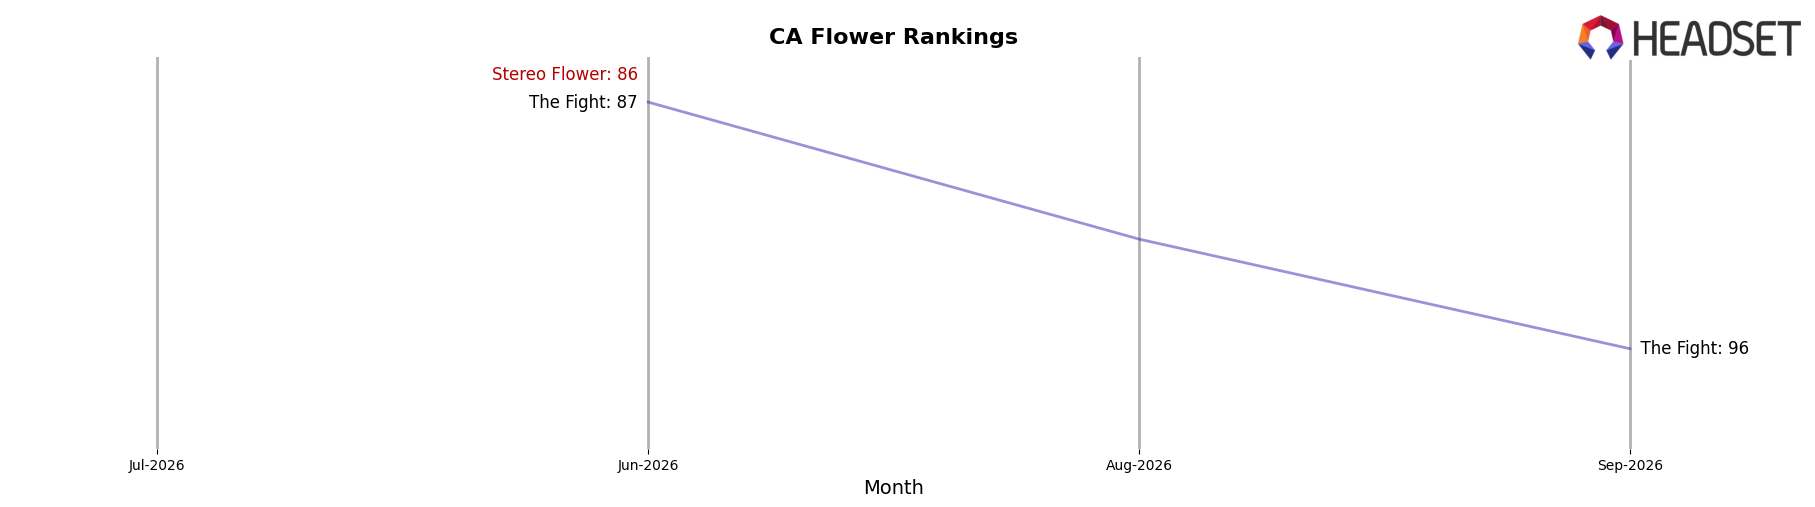
Stereo Flower sits at rank #210 in California Flower for September 2026, sliding 124 positions from #86 in June 2026 while reaching its peak rank of #86 in June 2026; against a market led by STIIIZY at #1 (up from #2 year over year) and CAM at #2 (up from #3 year over year), the brand’s move from #86 three months ago to #210 now marks a steep relative share loss as top players post gains of 47.8% and 28.9% in year-over-year sales respectively. With Oakfruitland rising from #11 to #5 on 73.5% year-over-year sales growth while CannaBiotix (CBX) falls from #1 to #3 on a -21.1% sales decline, Stereo Flower’s rank compression despite mixed competitor trajectories implies an erosion in distribution or velocity that, if unaddressed, points to continued share attrition through December 2026.
Notable Products
Reserve OG (3.5g) posted the steepest decline in September 2026 at -98.7% MoM, sliding to rank 6, while Black Orchid (3.5g) also fell -97.2% and sat at rank 7, indicating a sharp pullback in long-tail Flower SKUs even as Beverage ranks 3–5 contracted by -23.2% to -54.4%. The Gruntz (3.5g) delivered the largest MoM gain at +51.8% to hold rank 1, outpacing Pink Sherbet (3.5g) at +5.5% in rank 2, and four of the top ten are Flower SKUs, signaling concentration around fewer, higher-velocity eighths despite Beverage softness. CBD/THC 1:1 Yuzu Mint Hemp Infused Sparkling Green Tea (10mg CBD, 10mg THC, 12oz, 355ml) dropped -54.4% at rank 5 as the CBD/THC beverage trio occupied ranks 3–5 with negative MoM, contrasting with a Flower tier bifurcation where leaders gained share while mid-tier SKUs contracted. The pattern implies Stereo Flower is consolidating demand into a flagship Flower core while de-emphasizing or cycling out underperforming Flower variants and tolerating a smaller Beverage footprint.
Top Selling Cannabis Brands






Data for this report comes from real-time sales reporting by participating cannabis retailers via their point-of-sale systems, which are linked up with Headset’s business intelligence software. Headset’s data is very reliable, as it comes digitally direct from our partner retailers. However, the potential does exist for misreporting in the instance of duplicates, incorrectly classified products, inaccurate entry of products into point-of-sale systems, or even simple human error at the point of purchase. Thus, there is a slight margin of error to consider. Brands listed on this page are ranked in the top twenty within the market and product category by total retail sales volume.

