.svg)


Where to Buy
Fade Co. Holy Grail is stocked at 11 licensed dispensaries across Maryland, with the deepest coverage in Annapolis, Upper Marlboro, Baltimore, Hyattsville, and Mechanicsville. Search by ZIP code or city below to find the closest one, or filter by product type if you are after a specific format.
Market Insights Snapshot
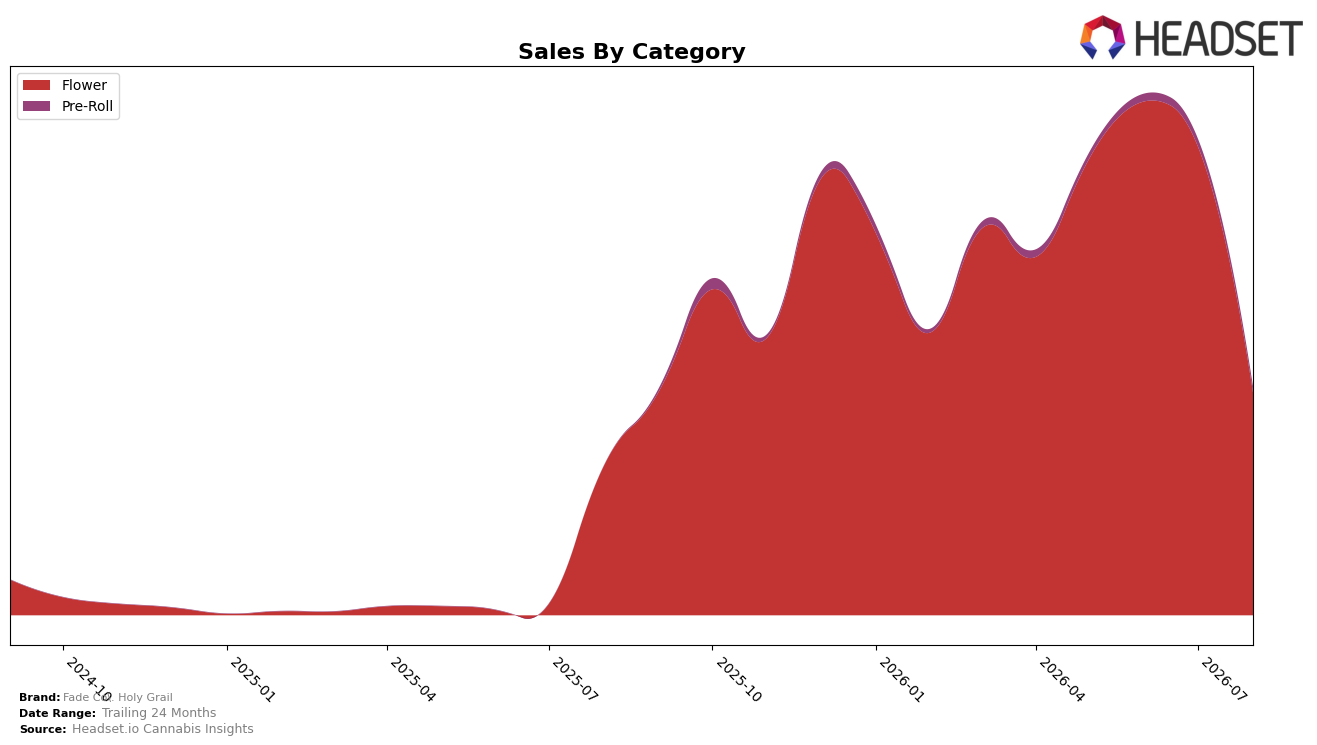
In August 2026, Fade Co. Holy Grail concentrated 97.57% of sales in Flower while Pre-Roll held 2.43%, with Flower up 48.73% year over year but down 52.61% month over month, and Pre-Roll lacking a YoY read while falling 25.88% MoM. Average price declined 4.07% YoY to $37.89 as Flower averaged $39.39 and Pre-Roll $14.99, and the Flower rank in Maryland sat at position 30, implying that August’s pullback was mix- and velocity-driven rather than breadth-expansion.
Given a 52.43% YoY brand sales increase alongside a 52.61% MoM contraction in its 97.57% Flower anchor, the positioning skews toward a single-category bet that magnifies month-level volatility and caps rank mobility at 30 in Maryland. The 2.43% Pre-Roll share and 25.88% MoM decline suggest limited buffer against Flower swings, while a 4.07% YoY price decrease indicates the growth thesis is volume-led; together these patterns imply that incremental share gains will require either stabilizing Flower sell-through or diversifying mix to reduce dependence on one category.
Competitive Landscape
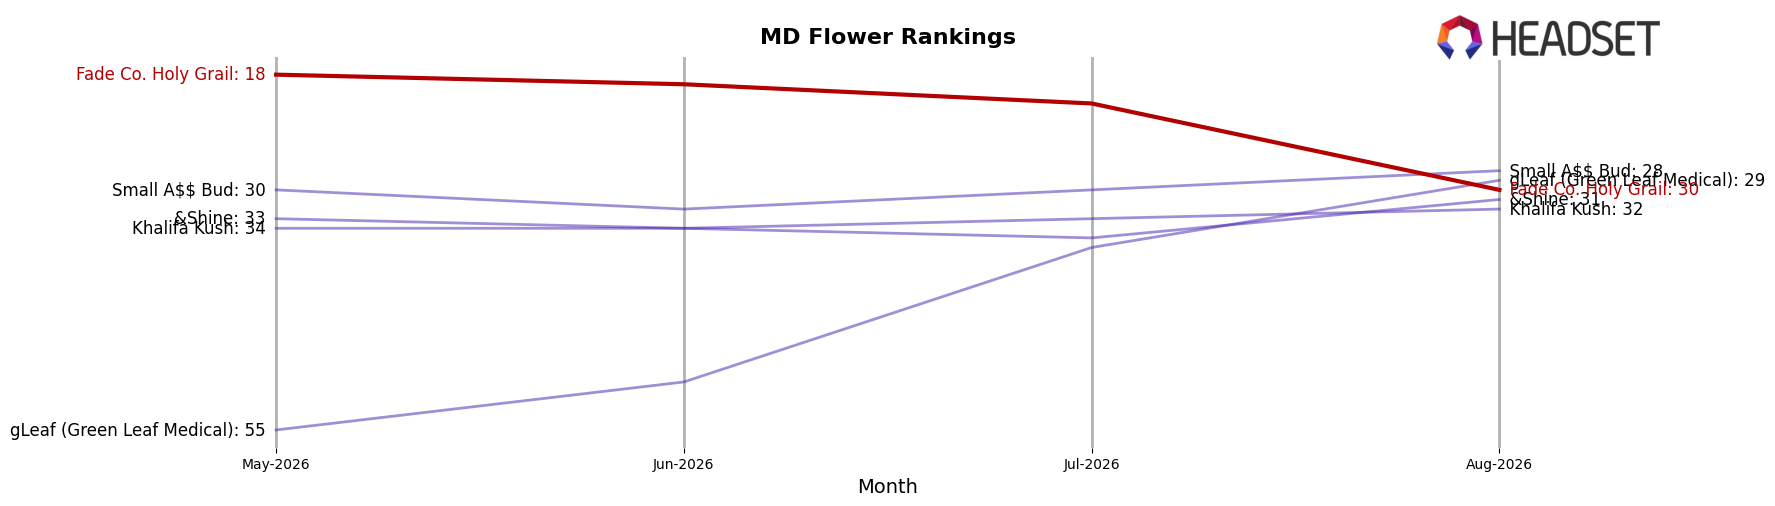
Fade Co. Holy Grail sits at rank #30 in August 2026, a 5-position improvement from #35 year over year but a 12-position slide from its May 2026 peak at #18, indicating recovery versus last year but loss of spring momentum; meanwhile, SunMed held steady at #1 year over year while Find. vaulted from #29 to #5, and District Cannabis stayed at #4 despite a -6.3% YoY sales change, signaling that August 2026 rank pressure is coming more from fast risers than incumbents—taken together, the trajectory implies Fade Co. Holy Grail must either reclaim the #18 range or risk being boxed out of the top 25 by competitors accelerating up the table.
Notable Products
Glitter Bomb (3.5g) posted the steepest decline in August 2026 at -52.2% while dropping to rank 4, and Cadillac Rainbows Smalls (14g) fell -57.3% at rank 10; together these outsized drops contrast with Cadillac Rainbows (3.5g) rising +18.2% at rank 1, pointing to a shift away from value/large-format and certain mid-tier Flower toward a single flagship SKU. Velvet Pie (3.5g) slid -41.5% at rank 2 as White Wedding (3.5g) was nearly flat at +1.2% at rank 3, and six of the top ten are Flower SKUs, signaling a portfolio still concentrated in Flower even as Pre-Rolls enter the top 10 at ranks 8 and 9 with no measurable month-over-month baselines. The mix implies Fade Co. Holy Grail is consolidating demand into a premium 3.5g hero while breadth SKUs absorb volatility, suggesting near-term emphasis on depth behind one anchor rather than wide-format expansion.
Top Selling Cannabis Brands






Data for this report comes from real-time sales reporting by participating cannabis retailers via their point-of-sale systems, which are linked up with Headset’s business intelligence software. Headset’s data is very reliable, as it comes digitally direct from our partner retailers. However, the potential does exist for misreporting in the instance of duplicates, incorrectly classified products, inaccurate entry of products into point-of-sale systems, or even simple human error at the point of purchase. Thus, there is a slight margin of error to consider. Brands listed on this page are ranked in the top twenty within the market and product category by total retail sales volume.

