.svg)


Where to Buy
Mother Exotic is stocked at 16 licensed dispensaries across Maryland and Nevada, 14 of them in Maryland, with the deepest coverage in Baltimore, Annapolis, Bethesda, Capitol Heights, and Delmar. Search by ZIP code or city below to find the closest one, or filter by product type if you are after a specific format.
Market Insights Snapshot
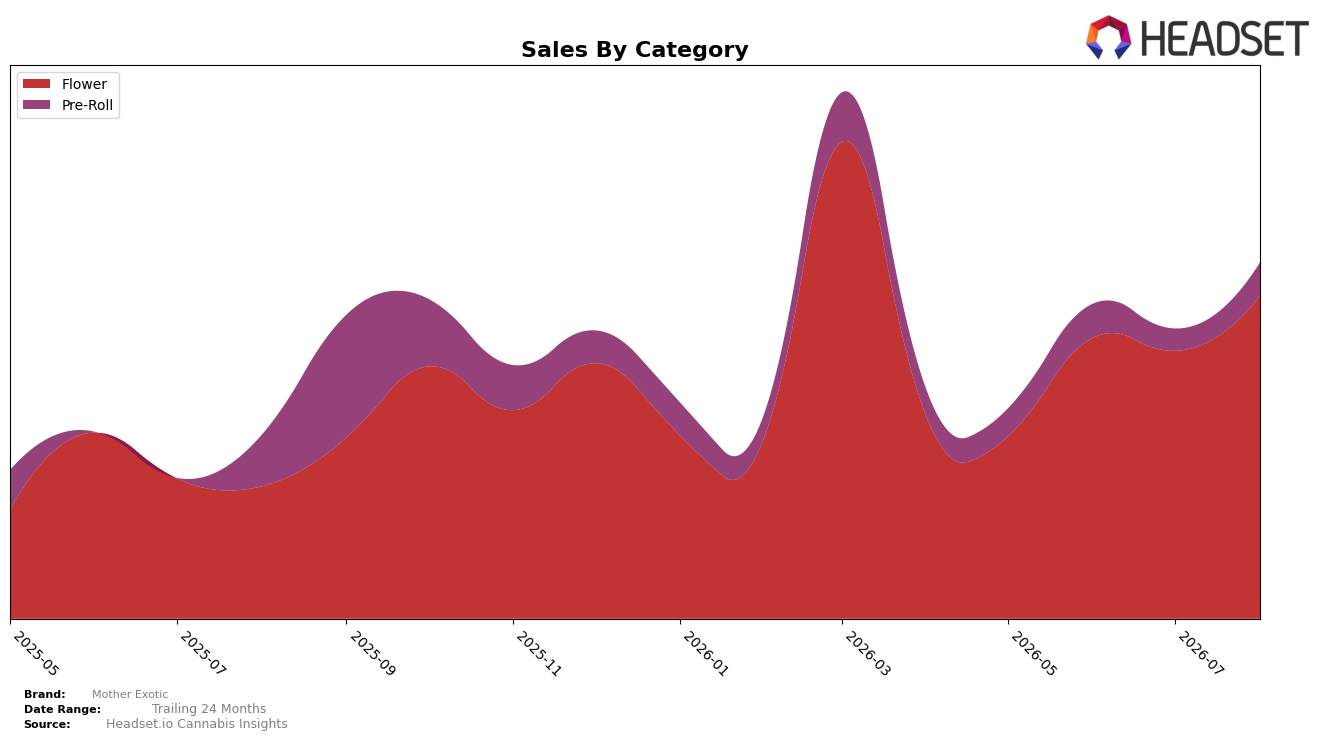
In August 2026, Mother Exotic concentrated 90.38% of sales in Flower with a 142.95% year-over-year gain and a 20.33% month-over-month lift, while Pre-Roll held 9.62% share with a 34.05% year-over-year decline but a 49.63% month-over-month rebound. The aggregate brand sales rose 93.10% year over year alongside a 32.79% increase in average price to $23.53, indicating unit growth outpacing price effects in Flower as its average price sat at 27.48 and Pre-Roll at 10.00. With Flower ranked 42 in Maryland and its mix expanding, the pattern implies a deepening specialization around Flower that is lifting month-over-month momentum but leaving minimal diversification headroom.
The divergence—Flower up 142.95% year over year versus Pre-Roll down 34.05% year over year, coupled with a 20.33% month-over-month Flower rise against a 49.63% Pre-Roll jump—implies August 2026 demand is anchored in Flower while volatility in smaller-format Pre-Roll can swing short-term mix. Given the brand-wide 93.10% year-over-year sales increase and 32.79% higher average price, the 42 rank in Maryland Flower suggests pricing power is being exercised within a mid-pack position, implying that further share gains will likely come from deepening Flower penetration rather than broad category expansion.
Competitive Landscape
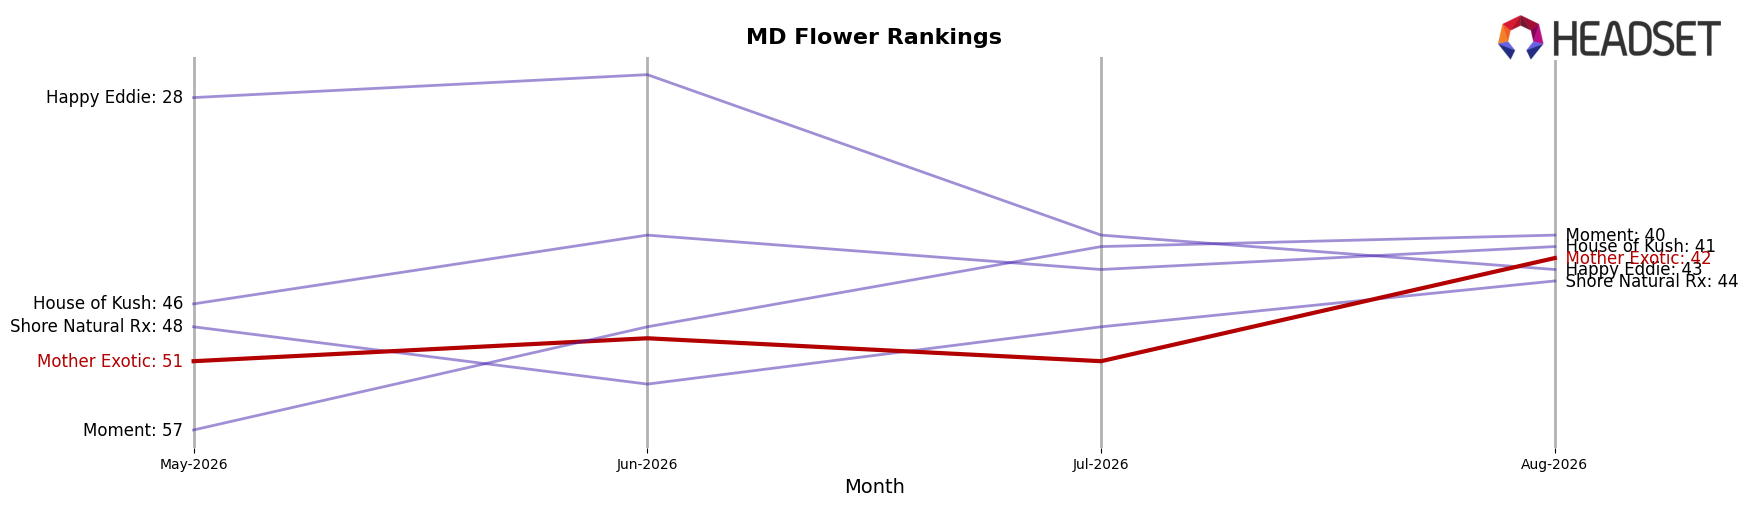
Mother Exotic sits at rank #42 in MD Flower in August 2026, improving 9 positions from #51 year over year, while also advancing 9 places versus its May 2026 rank of #51; this is the brand’s peak position to date at #42 in August 2026, yet it remains outside the top 40 as leaders like SunMed held #1 both year over year and in August 2026 and Find. jumped from #29 to #5 year over year, indicating that Mother Exotic’s steady climb is not matching the accelerated laddering seen among faster-rising rivals and implies a trajectory of incremental gains that may cap out unless velocity accelerates.
Notable Products
Formula Z (3.5g) posted the largest movement with an 85.9% month-over-month gain to rank 1, while BTY OG (3.5g) fell 32.1% to rank 3. Formula Z Pre-Roll 2-Pack (1g) also crossed the +50% threshold at +54.2% while ranking 5, and Illemonati (3.5g) declined 34.2% at rank 6. Four of the top ten are Flower SKUs while three are Pre-Roll SKUs, and the concentration in Flower at ranks 1, 2, and 3 points to portfolio gravity around flagship eighths. The pattern implies Mother Exotic is consolidating share around the Formula Z family, with Pre-Rolls acting as a secondary engine rather than a category lead.
Top Selling Cannabis Brands






Data for this report comes from real-time sales reporting by participating cannabis retailers via their point-of-sale systems, which are linked up with Headset’s business intelligence software. Headset’s data is very reliable, as it comes digitally direct from our partner retailers. However, the potential does exist for misreporting in the instance of duplicates, incorrectly classified products, inaccurate entry of products into point-of-sale systems, or even simple human error at the point of purchase. Thus, there is a slight margin of error to consider. Brands listed on this page are ranked in the top twenty within the market and product category by total retail sales volume.

