.svg)
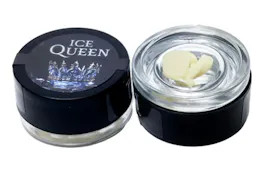
Aug-2026
Sales
Trend
6-Month
Product Count
SKUs
Avg Price
YoY Sales Change
YoY Price Change


Where to Buy
Ice Queen is stocked at 42 licensed dispensaries across Washington, with the deepest coverage in Seattle, Spokane, Everett, Lacey, and Vancouver. Search by ZIP code or city below to find the closest one, or filter by product type if you are after a specific format.
Market Insights Snapshot
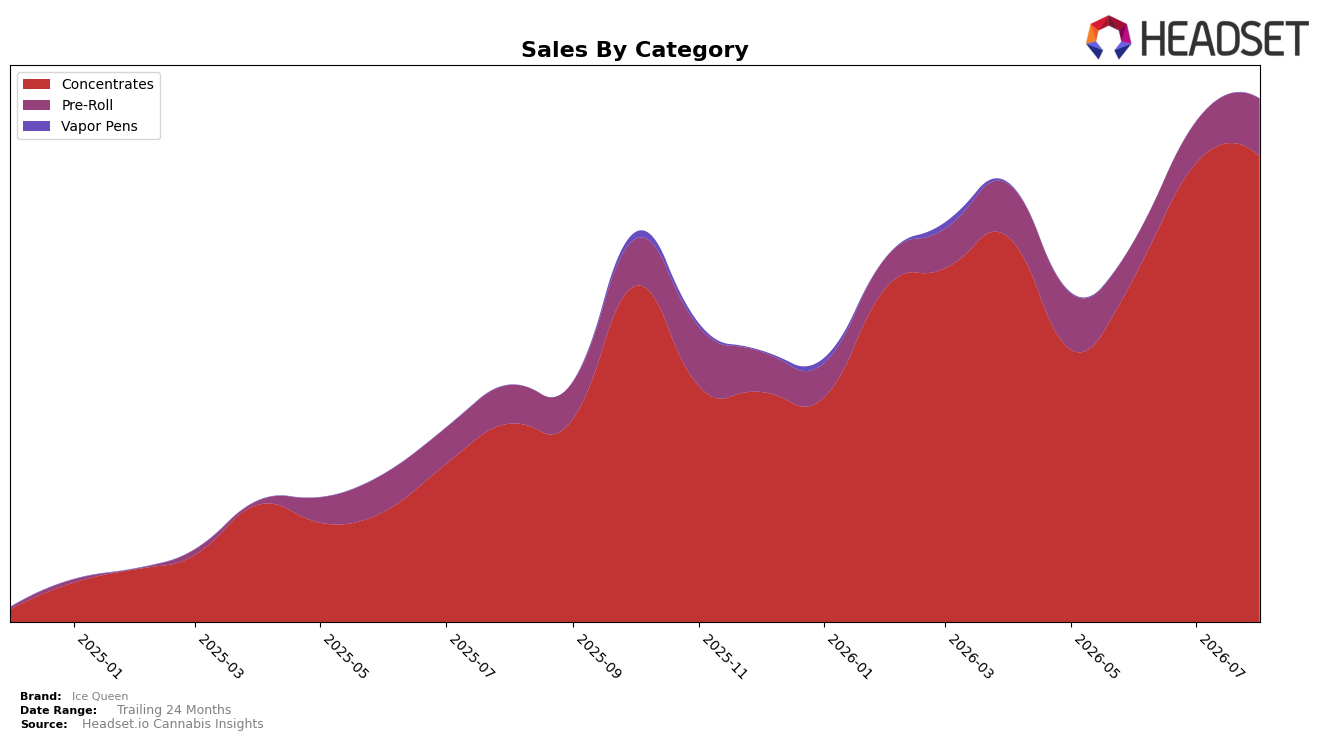
In August 2026, Ice Queen concentrated 89.07% of sales in Concentrates while Pre-Roll held 10.93%, a split that moved alongside divergent growth rates: Concentrates rose 135.05% year over year with a modest 1.55% month over month increase, whereas Pre-Roll advanced 49.19% year over year but jumped 38.31% month over month. The brand’s average price increased 27.37% year over year to $15.02, with Concentrates averaging $17.27 and Pre-Roll at $7.28, indicating mix-driven pricing lift tied to the 89.07% share in the higher-priced category. Ice Queen ranked 42 in Concentrates in Washington, pairing a large category weight with a mid-table position. The pattern implies a heavy dependence on Concentrates for scale while near-term trajectory hinges on Pre-Roll’s faster month over month expansion despite its smaller share.
With Concentrates contributing 89.07% share and growing 135.05% year over year but only 1.55% month over month, Ice Queen’s current positioning is anchored in depth rather than recent velocity, while the 38.31% month over month rise in Pre-Roll on just 10.93% share signals a potential lever for incremental reach without diluting the core. The 27.37% year over year price increase alongside a 42 rank in Concentrates in Washington suggests pricing headroom remains tied to Concentrates’ scale, but near-term share shifts will likely be dictated by how much of the MoM momentum in Pre-Roll can be converted before it materially changes the mix. The implication is that Ice Queen can protect category authority through Concentrates while using Pre-Roll’s month over month acceleration to hedge ranking risk and broaden baskets without overexposing margin.
Competitive Landscape
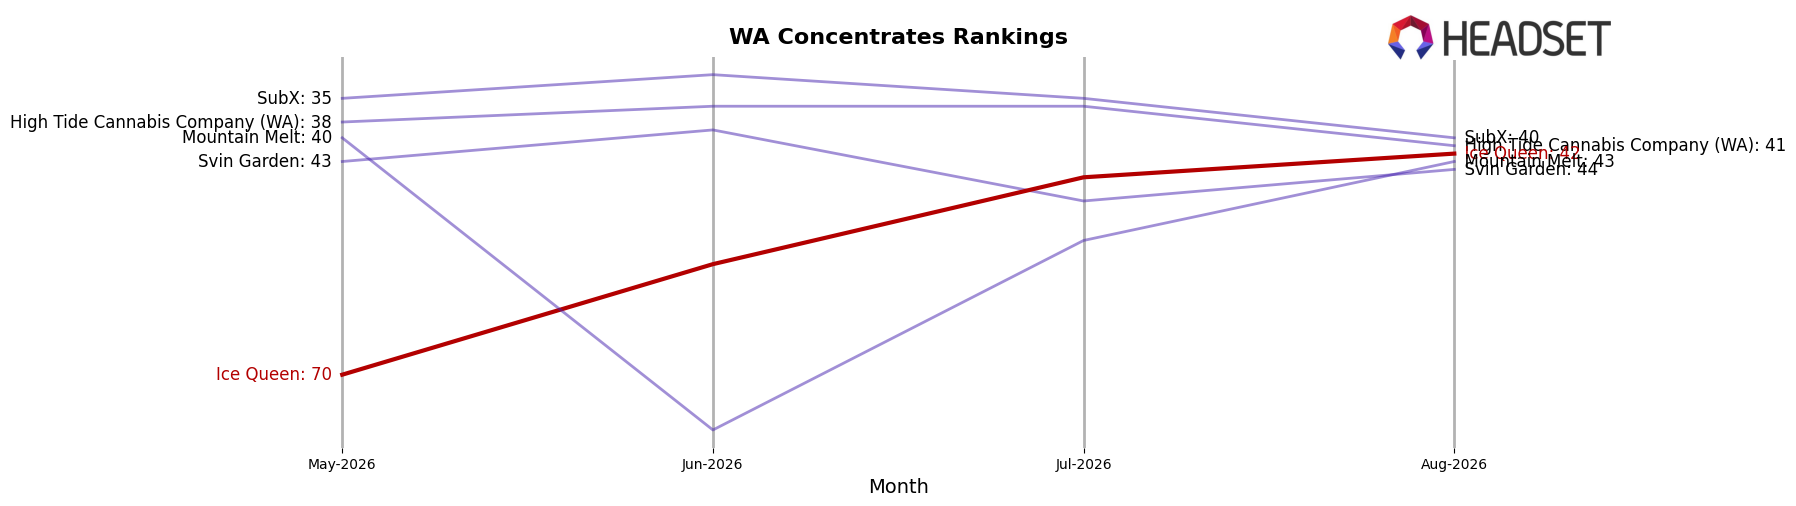
Ice Queen is ranked #42 in Washington Concentrates in August 2026, climbing 50 positions from #92 year over year, and rising 28 spots from #70 in May 2026 to reach its peak at #42 in August 2026; in the same period, Ooowee held at #1 while its year-over-year sales fell 6.1%, and Constellation Cannabis advanced from #6 to #4 with a 15.9% sales increase, indicating Ice Queen’s rank gains are outpacing several top-tier incumbents despite mixed competitor momentum. With Buddy Boy Farms vaulting from #56 to #5 on 456.9% sales growth and Dabstract steady at #3 on 1.6% growth, Ice Queen’s ascent from #92 to #42 positions it as a mid-pack climber whose trajectory implies ongoing share capture if it can convert rank momentum into sustained velocity against both entrenched leaders and breakout risers.
Notable Products
Swampwater Fumez Hash Rosin (1g) posted the standout move in August 2026 with a +63.9% month-over-month surge and climbed to rank 2, while GMO Cold Cure Rosin (1g) fell -34.6% and slid to rank 5. GMO Hash Rosin (1g) grew +34.6% and held rank 1, and Hashburger Cold Cure Hash Rosin (1g) declined -7.7% while sharing the top-3 tier with V6 Haze Hash Rosin (1g) at rank 3 after a +39.7% jump. Eight of the top ten are Concentrates, indicating a product mix skew where cold cure variants are diverging from standard hash rosin in momentum. The pattern implies Ice Queen is consolidating around fast-moving 1g rosin SKUs, tilting commercial focus toward Concentrates where upside is concentrated despite volatility in select cold cure entries.
Top Selling Cannabis Brands






Data for this report comes from real-time sales reporting by participating cannabis retailers via their point-of-sale systems, which are linked up with Headset’s business intelligence software. Headset’s data is very reliable, as it comes digitally direct from our partner retailers. However, the potential does exist for misreporting in the instance of duplicates, incorrectly classified products, inaccurate entry of products into point-of-sale systems, or even simple human error at the point of purchase. Thus, there is a slight margin of error to consider. Brands listed on this page are ranked in the top twenty within the market and product category by total retail sales volume.

