.svg)

Aug-2026
Sales
Trend
6-Month
Product Count
SKUs
Avg Price
YoY Sales Change
YoY Price Change


Where to Buy
LMFAO Cannabis is stocked at 93 licensed dispensaries across California, with the deepest coverage in Los Angeles, Sacramento, San Jose, San Diego, and Santa Rosa. Search by ZIP code or city below to find the closest one, or filter by product type if you are after a specific format.
Market Insights Snapshot
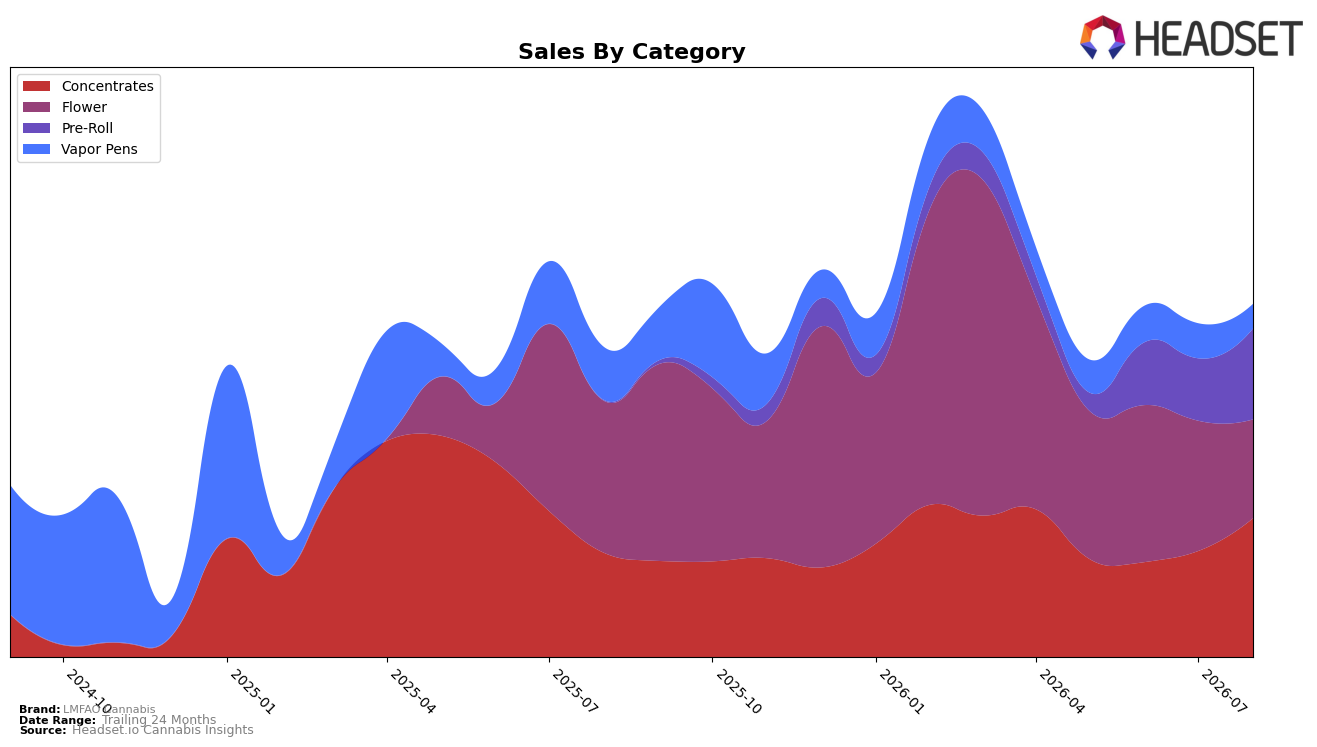
LMFAO Cannabis shifted its category mix sharply in August 2026, with Concentrates rising to 39.39% share on 33.16% YoY and 31.01% MoM growth, while Flower fell to 27.98% share on a 35.01% YoY decline and a 24.26% MoM drop. Pre-Roll expanded to 25.73% share with 18,452.98% YoY and 46.05% MoM growth, contrasting with Vapor Pens contracting to 6.90% share on 53.91% YoY and 30.12% MoM declines. In California Concentrates, the brand sits at rank 33, indicating mid-pack traction even as Concentrates and Pre-Roll now comprise 65.12% of mix. The pattern implies a pivot toward value-forward inhaleables anchored by rapid Pre-Roll scale and a recovering Concentrates engine, while retreating Flower and Vapor Pens signal resource reallocation away from slower-moving formats.
With average price down 34.96% YoY to $11.49 and Pre-Roll average price at $6.71 versus Flower at $30.22, the mix shift toward Pre-Roll and Concentrates aligns with a price-access strategy that can widen basket penetration but compress unit margins; concurrently, rank 33 in California Concentrates sets a ceiling that requires trade-up or differentiation to unlock higher ranks. The 31.01% MoM lift in Concentrates alongside a 46.05% MoM surge in Pre-Roll indicates near-term velocity concentrated in value-led formats, while the 24.26% MoM and 30.12% MoM declines in Flower and Vapor Pens point to reduced shelf depth and promotional intensity. This configuration implies positioning as a volume-oriented brand prioritizing accessible concentrates and pre-rolls over premium flower and cartridges, trading category depth for broader, price-sensitive reach.
Competitive Landscape
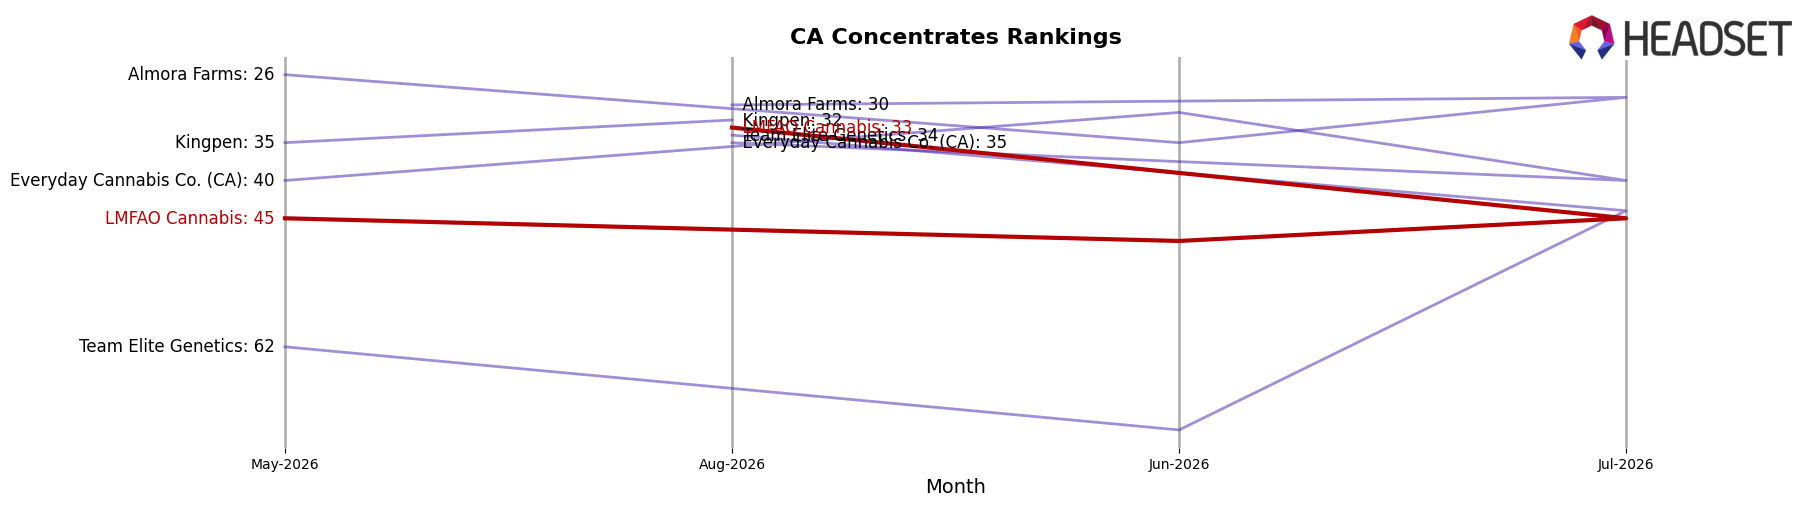
LMFAO Cannabis sits at rank #33 in CA Concentrates in August 2026, improving 16 positions year over year from #49, and rising 12 spots from #45 since May 2026; however, the brand remains 9 places below its peak at #24 from May 2025, signaling a partial recovery rather than a full return to prior positioning. Competitive pressure is acute at the top: Raw Garden held rank #1 with a 0-position YoY change while expanding sales by 9.9%, and 710 Labs climbed from #4 to #2 alongside a 33.5% YoY sales increase, indicating that LMFAO Cannabis’s mid-tier gains are occurring while leaders either hold or expand share. With STIIIZY sliding from #2 to #3 despite a 2.3% YoY sales decline and Punch Extracts / Punch Edibles moving from #3 to #4 amid a 10.1% sales drop, LMFAO Cannabis’s upward rank shift suggests opportunity to capitalize on softness just below the top tier, but the gap to its May 2025 peak implies execution must outpace both stable leaders and selectively weakening incumbents.
Notable Products
Kush Mints Pre-Roll (1g) posted the standout move in August 2026 with a 96.4% month-over-month surge to approximately $4.2k, climbing into rank 4 while Maui Wowie Pre-Roll (1g) jumped 72.7% to rank 1. Georgia Peach Pre-Roll (1g) advanced 65.8% into rank 3, and Sour Tangie Pre-Roll (1g) rose 66.5% to rank 6, indicating upward momentum concentrated at the top six ranks. Six of the top ten are Pre-Roll SKUs, while four Concentrates entered at ranks 7–10 with no reported month-over-month change, implying the gains are being pulled primarily by Pre-Rolls rather than a broad portfolio lift. The pattern implies LMFAO Cannabis is leaning into Pre-Rolls as the commercial engine while Concentrates provide breadth without yet contributing incremental month-over-month velocity.
Top Selling Cannabis Brands






Data for this report comes from real-time sales reporting by participating cannabis retailers via their point-of-sale systems, which are linked up with Headset’s business intelligence software. Headset’s data is very reliable, as it comes digitally direct from our partner retailers. However, the potential does exist for misreporting in the instance of duplicates, incorrectly classified products, inaccurate entry of products into point-of-sale systems, or even simple human error at the point of purchase. Thus, there is a slight margin of error to consider. Brands listed on this page are ranked in the top twenty within the market and product category by total retail sales volume.

