.svg)

Aug-2026
Sales
Trend
6-Month
Product Count
SKUs
Avg Price
YoY Sales Change
YoY Price Change


Where to Buy
Big Tree is stocked at 109 licensed dispensaries across California, Florida, and Washington, 107 of them in California, with the deepest coverage in Los Angeles, Sacramento, San Diego, Palm Springs, and Banning. Search by ZIP code or city below to find the closest one, or filter by product type if you are after a specific format.
Market Insights Snapshot
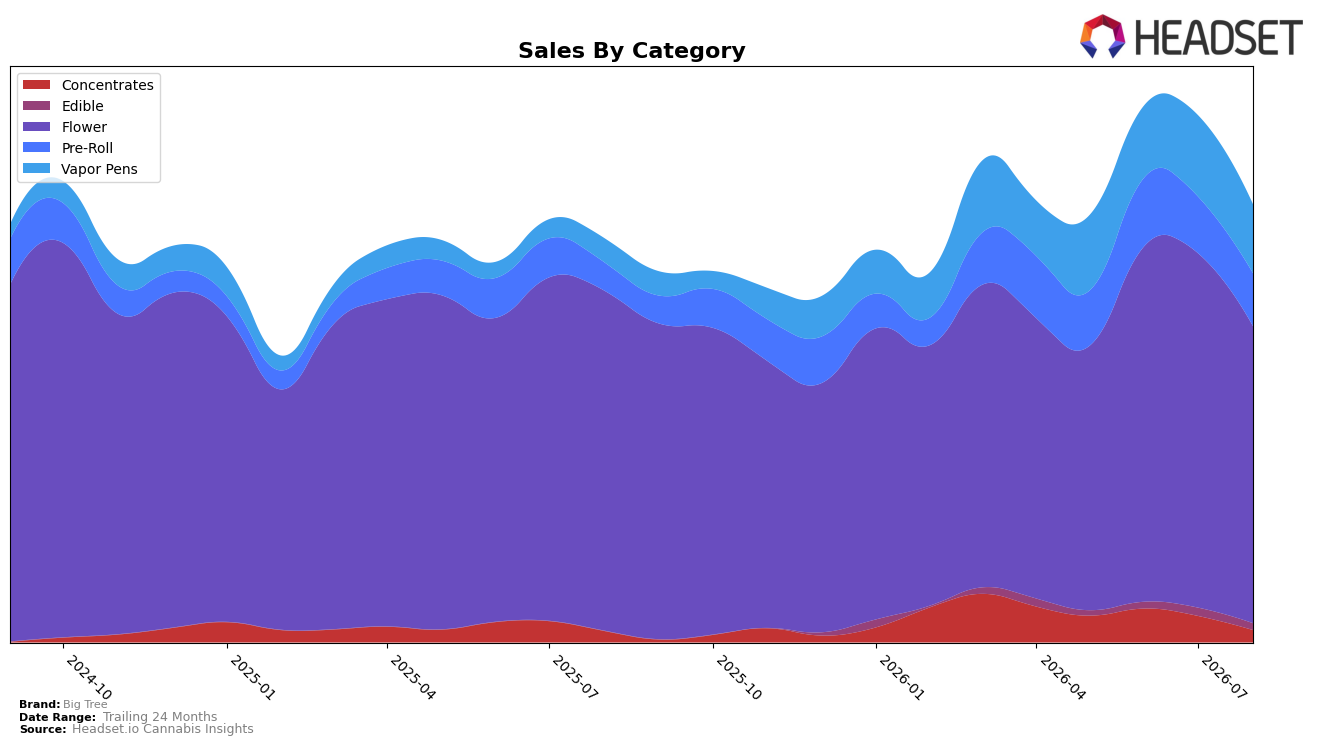
In August 2026, Big Tree’s mix tilted further toward core inhalables while the anchor weakened: Flower held 67.98% share but declined 12.85% year over year and 16.33% month over month, whereas Vapor Pens rose 187.30% year over year to 15.71% share despite a 15.55% month-over-month pullback. Pre-Roll expanded 87.91% year over year to 12.08% share even as it slipped 6.48% month over month, and Concentrates inched up 7.16% year over year but dropped 54.21% month over month to 2.75% share; Edible stayed small at 1.48% share with an 18.81% month-over-month dip. With Big Tree ranked 44 in Flower in California and the average brand price down 25.32% year over year to $11.52, the pattern implies a deliberate pivot toward lower-priced inhalable formats to offset Flower’s contraction while sacrificing near-term month-over-month velocity in several categories.
The shift toward Vapor Pens and Pre-Roll—together now 27.79% share alongside a 187.30% year-over-year and 87.91% year-over-year lift, respectively—suggests Big Tree is trading depth in Flower for breadth across faster-turning, price-accessible segments, which aligns with a 25.32% brand-wide price compression and a 8.15% year-over-year sales increase. However, the month-over-month declines in Flower (16.33%), Vapor Pens (15.55%), and Concentrates (54.21%) indicate the mix is sensitive to promotional cadence and inventory timing, implying that sustaining growth from this strategy will require steadier availability and pricing discipline rather than relying on episodic spikes.
Competitive Landscape
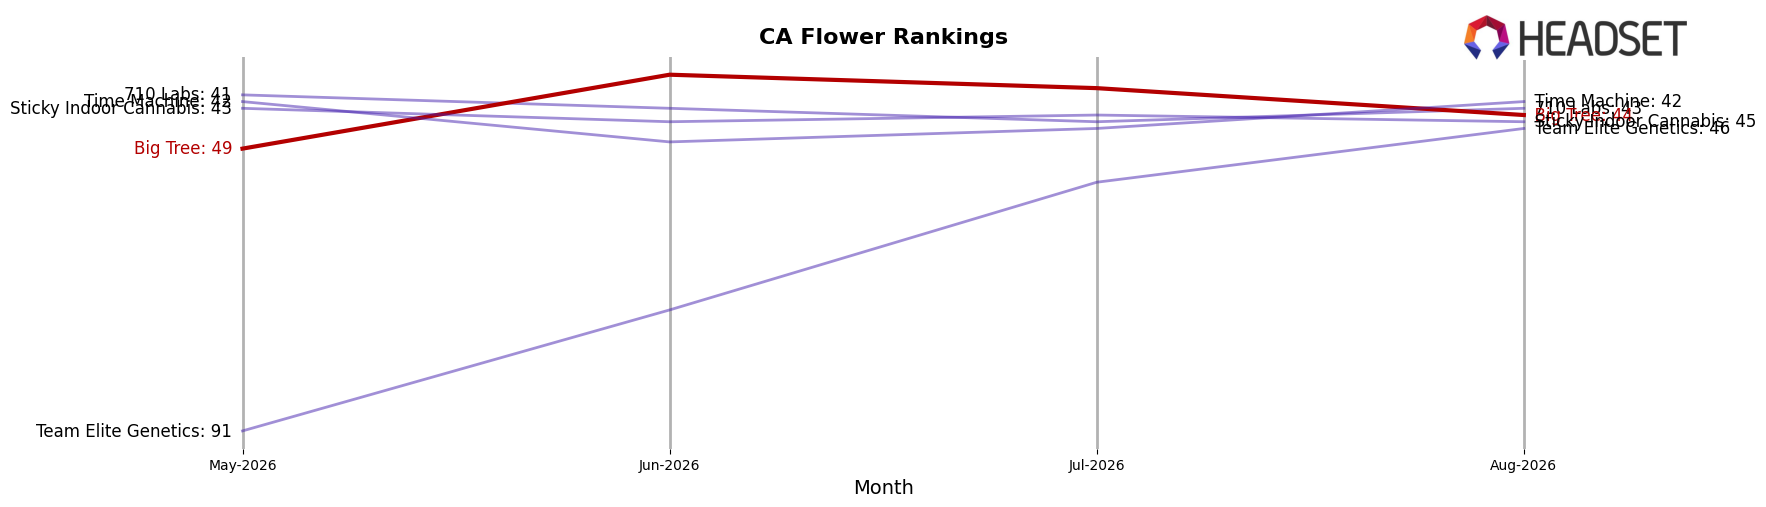
Big Tree sits at rank #44 in CA Flower for August 2026, down 7 positions year over year from #37 and up 5 spots versus May 2026’s #49, while its prior peak was #37 in September 2025; in contrast, STIIIZY moved from #2 to #1 and CAM climbed from #3 to #2, indicating top-tier rivals are consolidating share as CannaBiotix (CBX) fell from #1 to #3 with a 16.0% sales decline. Compared with three months ago Big Tree improved 10.2% in rank position terms (49 to 44) while year-over-year it declined 18.9% (37 to 44), and peers such as Oakfruitland jumped from #14 to #5 alongside a 79.9% sales increase. The pattern implies Big Tree’s modest quarter-on-quarter recovery has not offset a broader year-over-year slide as ascendant competitors tighten the top ranks, so holding in the mid-40s suggests stabilization rather than a return to prior peak without a share-accretive move.
Notable Products
Space Monster Pre-Roll (1g) led movement in August 2026 with a −27.6% month-over-month drop and a rank of 3, while Black Cherry OG (3.5g) fell −44.8% and Truffle Butter (3.5g) declined −42.1% from July 2026; together these declines outweigh the +10.1% lift for Space Burger (3.5g) at rank 2. Flower holds 7 of the top 10 slots, with Shishkaberry (3.5g) at rank 1 and multiple Flower SKUs posting double-digit declines alongside one double-digit gainer, concentrating risk in a single category despite one SKU posting $16,692. The pattern implies Big Tree is leaning toward a Flower-heavy assortment where volatility is rising across top SKUs, signaling a need to rebalance mix and stabilize pre-roll contribution.
Top Selling Cannabis Brands






Data for this report comes from real-time sales reporting by participating cannabis retailers via their point-of-sale systems, which are linked up with Headset’s business intelligence software. Headset’s data is very reliable, as it comes digitally direct from our partner retailers. However, the potential does exist for misreporting in the instance of duplicates, incorrectly classified products, inaccurate entry of products into point-of-sale systems, or even simple human error at the point of purchase. Thus, there is a slight margin of error to consider. Brands listed on this page are ranked in the top twenty within the market and product category by total retail sales volume.

