.svg)


Where to Buy
Mad Packs is stocked at 108 licensed dispensaries across Michigan, with the deepest coverage in New Buffalo, Detroit, Monroe, Inkster, and Center Line. Search by ZIP code or city below to find the closest one, or filter by product type if you are after a specific format.
Market Insights Snapshot
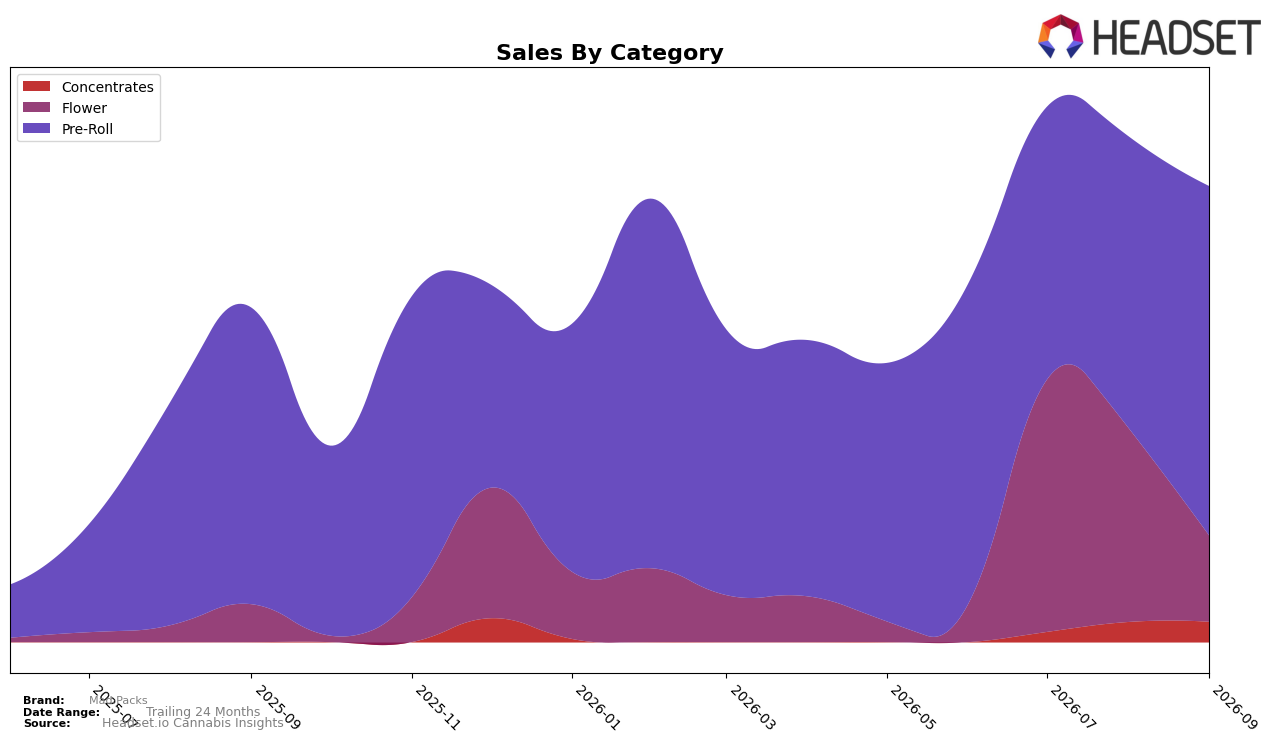
In September 2026, Mad Packs concentrated 76.72% of sales in Pre-Roll, up 20.02% month over month and 17.92% year over year, while Flower held 18.80% share with a 127.68% year-over-year gain but a 55.95% month-over-month contraction; Concentrates accounted for 4.48% share with a 1.08% month-over-month uptick and no year-over-year baseline. The brand’s average price rose 11.11% year over year to $7.66, with Pre-Roll averaging $6.24 and Flower at $35.52, indicating mix-driven price dispersion as volume pivoted toward lower-priced Pre-Rolls despite a volatile Flower swing. With Pre-Roll ranked 49 in Michigan, the pattern implies Mad Packs is leaning into a high-volume Pre-Roll core while tolerating sharp Flower retracement to protect overall growth, as evidenced by total brand sales up 36.39% year over year.
The juxtaposition of a 20.02% month-over-month Pre-Roll increase against a 55.95% month-over-month Flower decline suggests demand consolidation into the lead format rather than broad-based category lift, while the 127.68% year-over-year Flower surge paired with a modest 1.08% month-over-month gain in Concentrates points to experimentation that has not translated into sustained monthly throughput. Given a 49th-place Pre-Roll rank in Michigan alongside a 76.72% mix weight, the brand’s positioning hinges on improving velocity within Pre-Roll to stabilize revenue, using Concentrates as a low-risk adjacency and treating Flower as an opportunistic rather than steady growth pillar.
Competitive Landscape
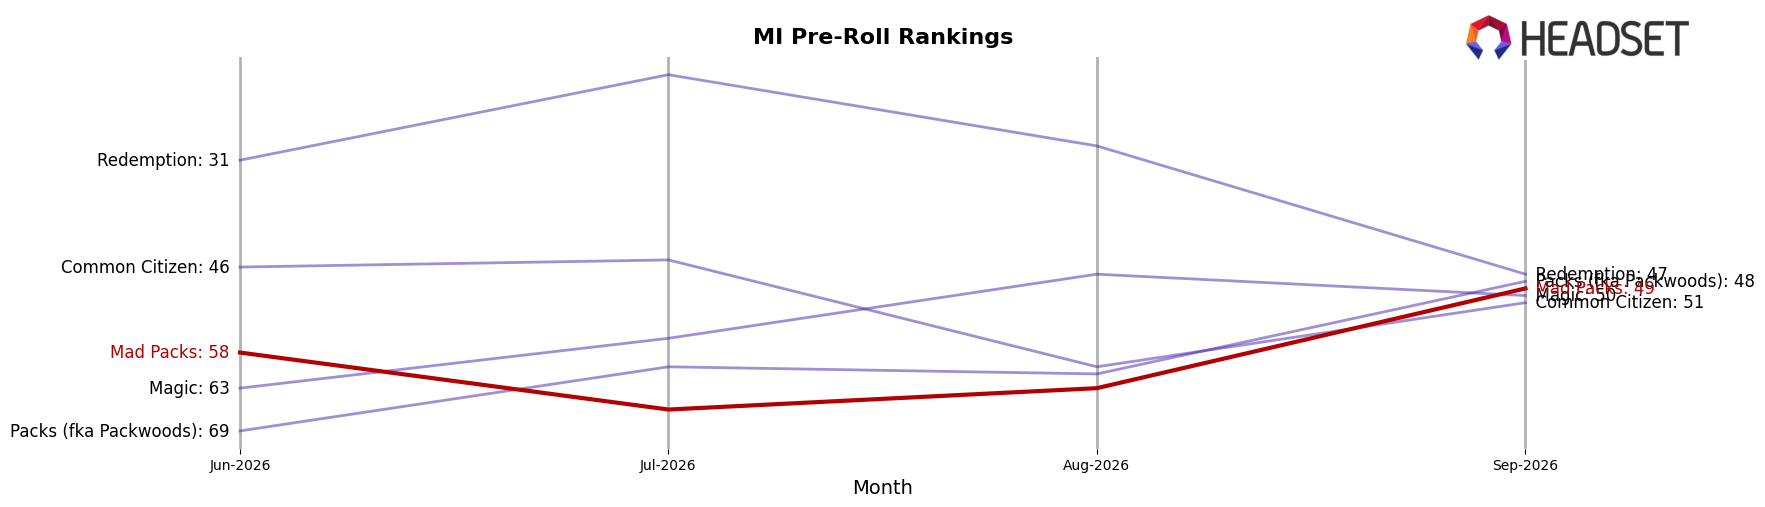
Mad Packs sits at rank 49 in MI Pre-Roll for September 2026, improving 4 positions from rank 53 year over year and climbing 9 spots from rank 58 since June 2026, while remaining 12 positions below its February 2026 peak at rank 37; meanwhile, Jeeter held at #1 year over year as Mitten Extracts advanced from #5 to #4, indicating competitors are either holding or gaining share as Mad Packs edges upward in the lower tier. With Cali-Blaze steady at #2 despite a -36% year-over-year sales shift and Goodlyfe Farms sliding one rank from #4 to #5, Mad Packs’ 4-rank YoY gain and 9-rank quarter-on-quarter rise point to opportunistic movement driven by churn among ranks 4–5 rather than displacement at the top, implying a path to mid-tier re-entry depends on sustaining share capture from faltering mid-pack players rather than top-spot upheaval.
Notable Products
Tarantula - Maui Wowie Infused Pre-Roll (1.3g) delivered the standout move in September 2026 with a 60.7% month-over-month jump to rank 2, while Tarantula - Sex on the Beach Infused Pre-Roll (1.3g) held rank 1 with a smaller 1.4% lift, indicating momentum is shifting within the top tier toward the faster-rising SKU. Tarantula - Strawberry Daiquiri Infused Pre-Roll (1.3g) climbed at +28.2% to rank 3, and Tarantula - Baja Freeze Infused Pre-Roll (1.3g) advanced +30.9% at rank 8, while five other Tarantula pre-rolls posted modest gains between +0.5% and +5.2%, pointing to a widening gap between the leaders and the long tail. Nine of the top ten are Pre-Roll SKUs from the Tarantula line, and the only new Hi-Lo entries debuted at ranks 9 and 10 with no month-over-month baselines, which keeps the category concentrated at the top while leaving the lower end open for trial. The mix implies Mad Packs is consolidating share around a few high-velocity Tarantula variants, signaling a strategy to double down on lead flavors while using lower-ranked introductions as pipeline tests rather than volume drivers.
Top Selling Cannabis Brands






Data for this report comes from real-time sales reporting by participating cannabis retailers via their point-of-sale systems, which are linked up with Headset’s business intelligence software. Headset’s data is very reliable, as it comes digitally direct from our partner retailers. However, the potential does exist for misreporting in the instance of duplicates, incorrectly classified products, inaccurate entry of products into point-of-sale systems, or even simple human error at the point of purchase. Thus, there is a slight margin of error to consider. Brands listed on this page are ranked in the top twenty within the market and product category by total retail sales volume.

