.svg)

Aug-2026
Sales
Trend
6-Month
Product Count
SKUs
Avg Price
YoY Sales Change
YoY Price Change


Where to Buy
MWAH is stocked at 181 licensed dispensaries across Washington and California, 169 of them in Washington, with the deepest coverage in Seattle, Spokane, Tacoma, Vancouver, and Everett. Search by ZIP code or city below to find the closest one, or filter by product type if you are after a specific format.
Market Insights Snapshot
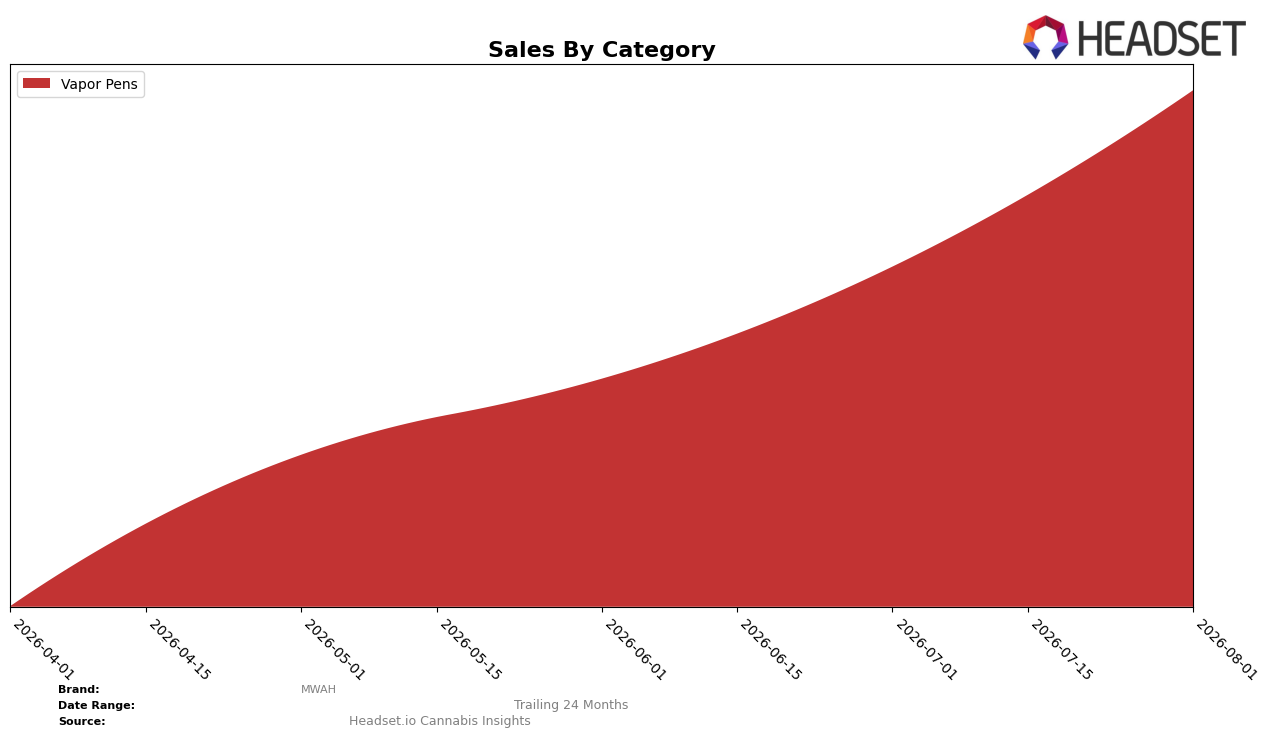
In August 2026, MWAH was fully concentrated in Vapor Pens with a 100.0% category share, and the segment’s month-over-month movement accelerated by 45.7% while average price held at $27.25; paired with a Washington Vapor Pens rank of 13, the mix signals momentum within a single-category footprint rather than diversification. With year-over-year data unavailable and a 100.0% share preventing cross-category offsets, the 45.7% MoM lift combined with a rank position of 13 implies that recent gains are driven by velocity within Vapor Pens rather than portfolio breadth, making any pricing or distribution shift in this category disproportionately impactful.
The concentration risk is rising as the 45.7% MoM increase in Vapor Pens volume coincides with a rank of 13 in Washington, creating a scenario where sustaining share requires continued execution in a single channel and minimal missteps on price around the $27.25 level. Given the 100.0% category share and no YoY read, the immediate implication is to defend and climb from rank 13 through tighter assortment and repeat retention in Vapor Pens, because any softening in that lane would directly translate to total-brand contraction without other categories to buffer volatility.
Competitive Landscape
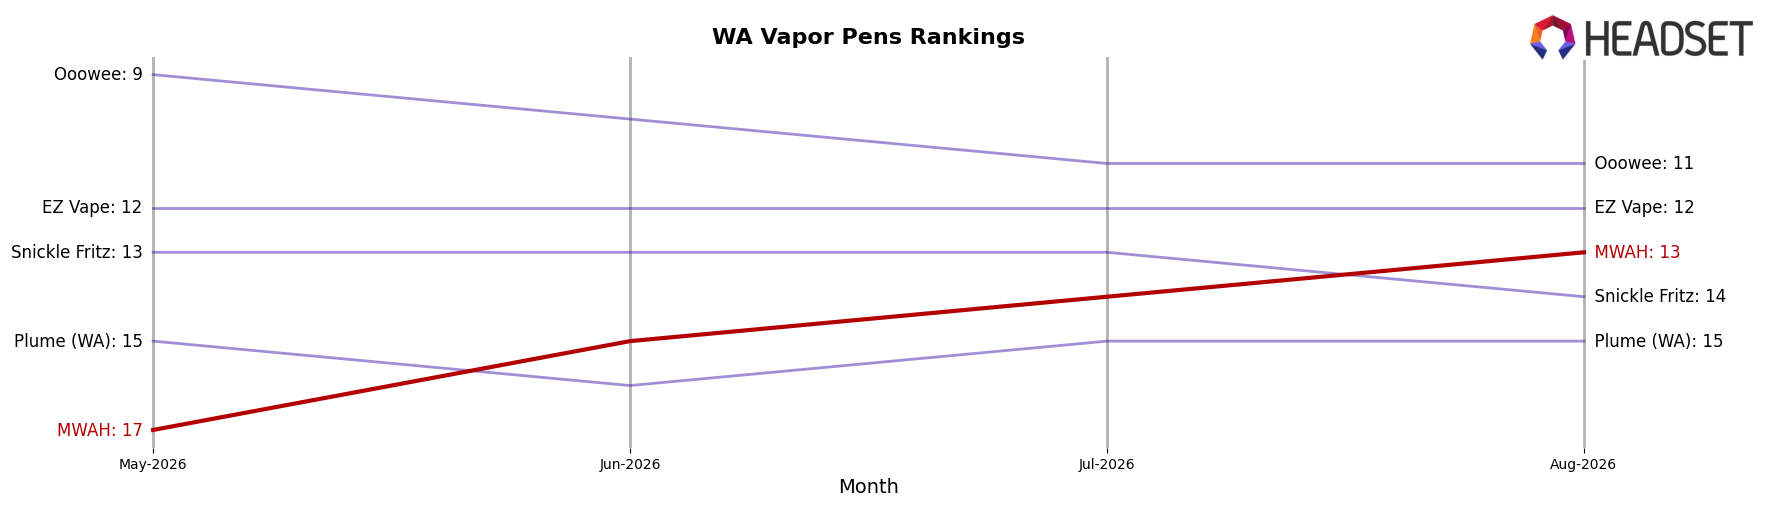
MWAH is ranked #13 in WA Vapor Pens in August 2026, up 4 places from #17 in May 2026, and matching its peak rank of #13 in August 2026; the lack of a reported year-over-year rank prevents a direct YoY comparison, but a 4-rank climb quarter-over-quarter indicates momentum relative to category leaders. Among competitors, Crystal Clear holds #1 with a +3 YoY rank change while growing sales by 19.4%, and Mfused sits at #2 with a +1 YoY rank shift despite a 32.6% sales decline, indicating that MWAH’s move from #17 to #13 is outpacing rank stability at the very top even as sales mixes shift. With Plaid Jacket at #3 and +6 YoY ranks versus Full Spec at #4 and +5 YoY ranks, MWAH’s August 2026 peak at #13 and 4-position rise since May 2026 imply room to capture mid-tier share as some incumbents trade rank gains for mixed sales trends.
Notable Products
Grape Blowpop Distillate Disposable (1g) posted the steepest movement in August 2026 with a -36.1% month-over-month decline and slid to rank 9, implying a sharp pullback for a fringe SKU even as the category advanced. In contrast, Mango Mamacita Distillate Disposable (1g) rose 40.1% MoM to rank 2 while Berry Baddie Distillate Disposable (1g) climbed 35.0% MoM to hold rank 1, and four of the top five Vapor Pens gained between 16.3% and 40.1%, pointing to consolidation at the top around fruit-forward profiles. It's Giving Guava Distillate Disposable (1g) also advanced 37.3% MoM to rank 4, and Glow Up Grape Distillate Disposable (1g) increased 32.2% MoM to rank 6, reinforcing that momentum is concentrated in 1g distillate disposables rather than breadth across lower-ranked SKUs. The pattern implies MWAH is concentrating commercial energy on a narrow set of flagship Vapor Pen SKUs, prioritizing depth and velocity over long-tail variety despite isolated underperformance at the bottom of the ranking.
Top Selling Cannabis Brands






Data for this report comes from real-time sales reporting by participating cannabis retailers via their point-of-sale systems, which are linked up with Headset’s business intelligence software. Headset’s data is very reliable, as it comes digitally direct from our partner retailers. However, the potential does exist for misreporting in the instance of duplicates, incorrectly classified products, inaccurate entry of products into point-of-sale systems, or even simple human error at the point of purchase. Thus, there is a slight margin of error to consider. Brands listed on this page are ranked in the top twenty within the market and product category by total retail sales volume.

