.svg)


Where to Buy
PIXLZ by Gron is stocked at 142 licensed dispensaries across Missouri, New York, and 2 other states, 85 of them in Missouri, with the deepest coverage in Kansas City, St. Louis, Columbia, Springfield, and Branson. Search by ZIP code or city below to find the closest one.
Market Insights Snapshot
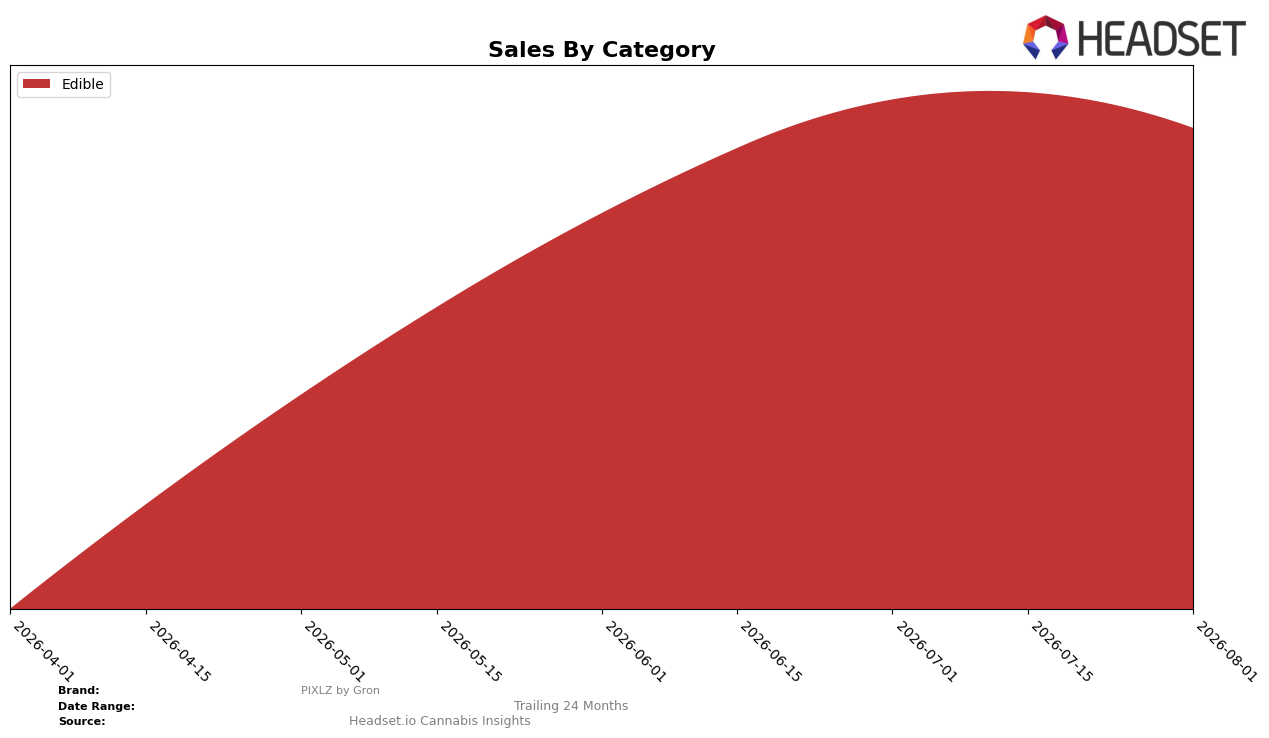
In August 2026, PIXLZ by Gron operated as a single-category brand, with Edible accounting for 100.0% of sales and an average price of $19.62, while month-over-month sales declined by 4.54% and the brand held a rank of 18 in Edible within Oregon. Year-over-year change for Edible was not reported (0 data visibility), and the negative 4.54% MoM alongside a stable 100.0% mix indicates concentration risk if category momentum softens; the pattern implies PIXLZ by Gron is overexposed to Edible cyclicality, with rank 18 suggesting mid-pack positioning vulnerable to further MoM slippage.
The unshifted 100.0% mix combined with a 4.54% MoM decline and a rank of 18 in Oregon implies PIXLZ by Gron is trading share for price stability at an average of $19.62 rather than diversifying into adjacent formats to buffer volatility. With New York as the highest-revenue state contextually and Edible at 100.0%, the positioning skews toward scale in a single format where any additional 2–5 rank drop could amplify visibility loss; the pattern implies prioritizing retention levers within Edible over multi-category expansion would most directly address the current -4.54% MoM drag.
Competitive Landscape
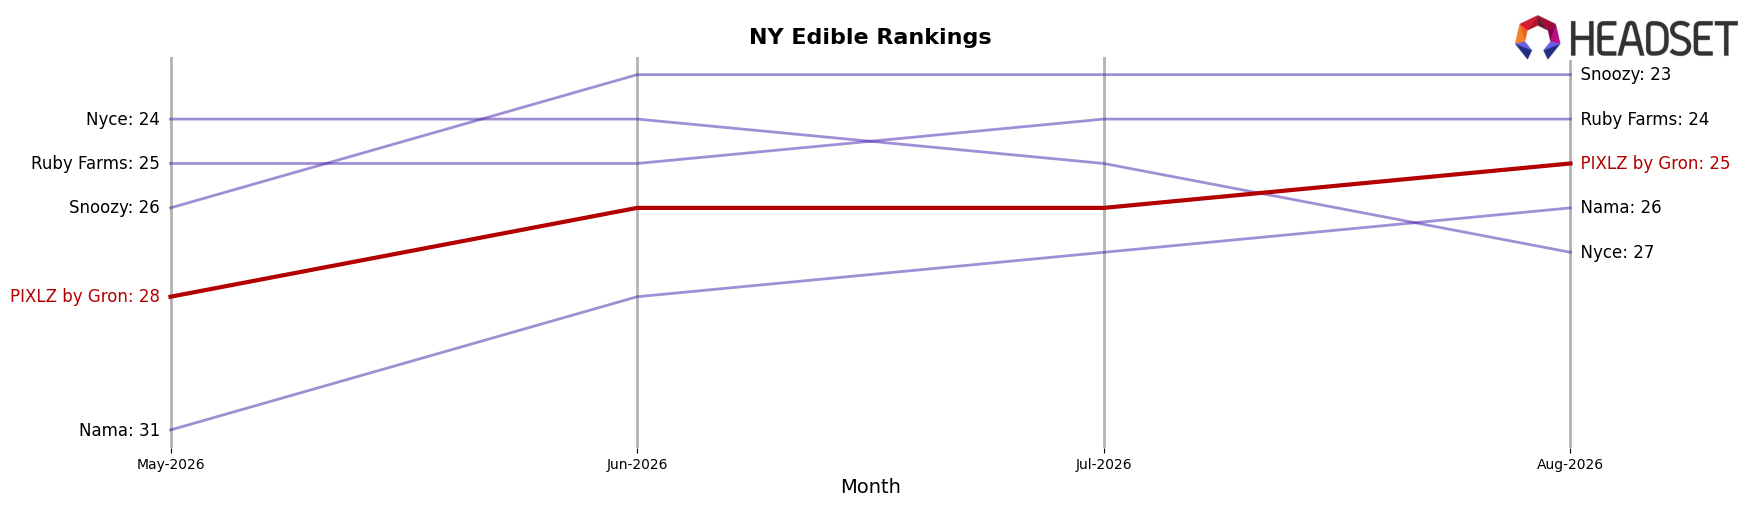
PIXLZ by Gron sits at rank #25 in NY Edible in August 2026, up 3 spots from #28 in May 2026, while the lack of a year-over-year rank baseline leaves the YoY change unspecified but capped by a new peak at #25 in August 2026. At the top end, Camino holds #1 after improving from #2 year over year and growing sales 10.5%, whereas Off Hours slipped from #1 to #2 with a 24.8% YoY sales decline, indicating that PIXLZ by Gron’s ascent from #28 to #25 is occurring as leadership positions churn above it. With Gron / Grön rising from #4 to #3 on 14.8% YoY sales growth and Wyld easing from #3 to #4 despite 7.1% YoY growth, PIXLZ by Gron’s incremental rank gain suggests a path to mid-tier relevance if it converts proximity to its parent brand’s momentum into sustained share capture.
Notable Products
Tropical Rush Gummy Clusterz 20-Pack (100mg) posted the steepest decline at -15.39% MoM while slipping to rank 3, and Berry Blast Candy (100mg) fell -14.21% at rank 5. In contrast, CBG/THC 3:1 Blue Razzberry Gummy Clusterz 20-Pack (300mg CBG, 100mg THC) gained +2.84% MoM to hold rank 1, and Tropical Rush Candy 20-Pack (100mg) rose +20.59% at rank 4. With all five top-5 SKUs in Edible and four of the top five in the Gummy Clusterz family, the mix tilts toward high-velocity gummy formats, implying PIXLZ by Gron is consolidating leadership around functional and flavor-led clusters rather than diversifying formats.
Top Selling Cannabis Brands






Data for this report comes from real-time sales reporting by participating cannabis retailers via their point-of-sale systems, which are linked up with Headset’s business intelligence software. Headset’s data is very reliable, as it comes digitally direct from our partner retailers. However, the potential does exist for misreporting in the instance of duplicates, incorrectly classified products, inaccurate entry of products into point-of-sale systems, or even simple human error at the point of purchase. Thus, there is a slight margin of error to consider. Brands listed on this page are ranked in the top twenty within the market and product category by total retail sales volume.

