

Sep-2026
Sales
Trend
6-Month
Product Count
SKUs
Avg Price
YoY Sales Change
YoY Price Change


Is this your brand?
See your full sales and distribution data: where you sell, how you're priced, and how you rank against the brands next to you on the shelf.
See your brand's dataCarry this brand in your store?
Headset Retailer is free. Connect your POS and see what's selling and what's sitting.
Sign up freeWhere to Buy
Pop's Weed is stocked at 42 licensed dispensaries across California, with the deepest coverage in Los Angeles, San Diego, Chula Vista, Modesto, and Needles. Search by ZIP code or city below to find the closest one, or filter by product type if you are after a specific format.
Market Insights Snapshot
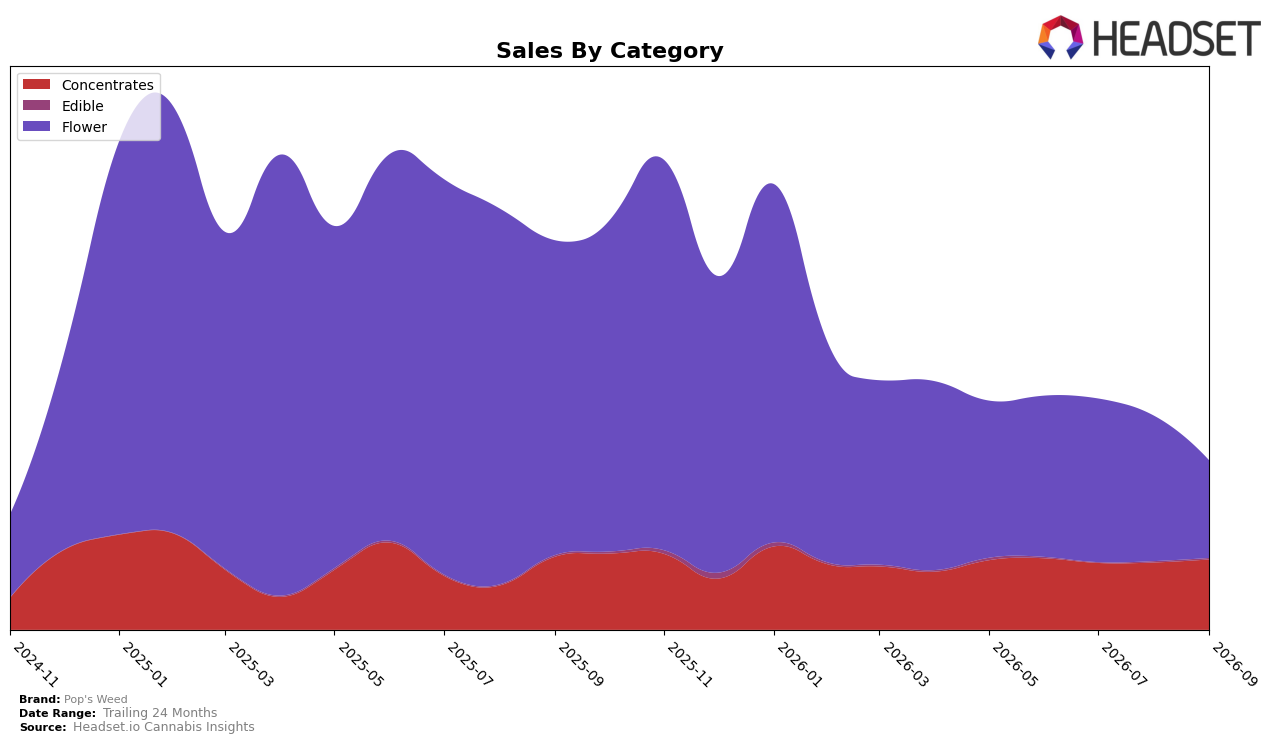
In September 2026, Pop's Weed’s category mix tilted toward Flower at 57.74% share despite a 69.13% year-over-year decline and a 33.14% month-over-month drop, while Concentrates held 41.66% share with a 3.65% YoY decline but a 4.63% MoM lift; Edible remained marginal at 0.60% share with a 16.54% YoY decline and an 8.75% MoM increase. The brand’s average price fell 15.23% YoY to $11.37 as Flower’s average price sat at $18.07 and Concentrates at $7.60, which, combined with the overall 56.71% YoY sales contraction and a Concentrates rank of 44 in California, indicates the mix is anchored by a shrinking Flower base while Concentrates provide incremental stability.
The divergence—deep Flower contraction alongside a modest MoM uptick in Concentrates and Edible—implies Pop's Weed is migrating toward value-forward inhalables, with Concentrates acting as the nearer-term volume stabilizer and Flower driving volatility; the 4.63% MoM gain in Concentrates versus the 33.14% MoM decline in Flower suggests resource allocation weighted toward Concentrates can mitigate further rank erosion. With 41.66% of sales in Concentrates but a 44th-place category position in California, the brand’s positioning skews toward price-sensitive missions, and the 15.23% YoY price decrease paired with a 3.65% YoY decline in Concentrates signals room to trade up pack sizes or potency tiers without amplifying the 56.71% YoY sales drop.
Competitive Landscape
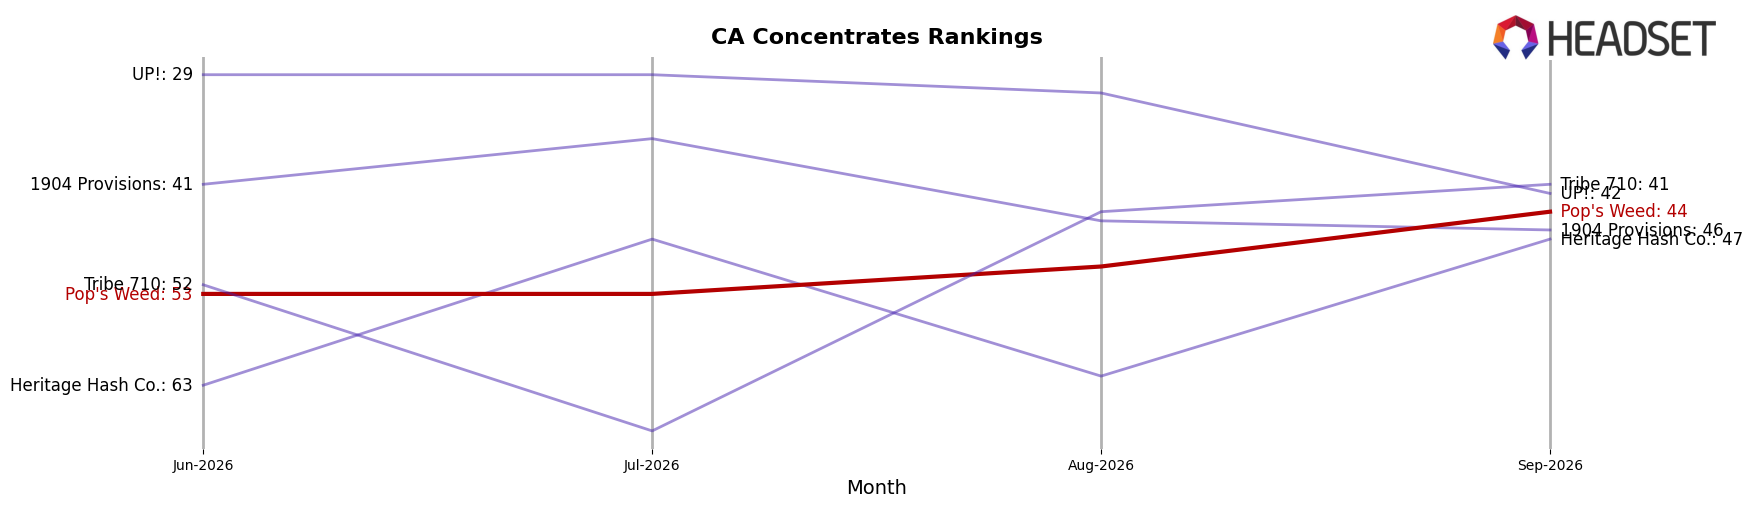
Pop's Weed is ranked #44 in CA Concentrates in September 2026, improving 9 positions year over year from #53, and matching a 3‑month gain from #53 to #44; this places the brand far below Raw Garden at #1 (flat YoY at #1 with 9.37% sales growth) and behind 710 Labs, which moved up from #4 to #2 with 32.70% YoY sales growth, while Hashish advanced from #9 to #5 with 92.03% YoY sales growth; the combination of a 9-rank YoY climb and a best-ever #44 peak in September 2026 implies Pop's Weed is gaining rank but at a slower pace than top movers, suggesting further share gains will require outpacing competitors that are improving by 2–4 rank positions at the top of the table.
Notable Products
Jetfuel Badder (1g) posted the standout move in September 2026 with a 110.9% month-over-month jump to rank 3, while Pop's OG (4g) slipped 10.5% to a tie for rank 9. Panty Dropper Badder (1g) held rank 1 with a 12.8% lift and Runtz Badder (1g) advanced 49.2% into rank 2, and five of the top five are Concentrates, indicating category density at the top. Marathon OG (4g) climbed 52.4% to rank 6 as the leading Flower, whereas Unicorn Cookies Badder (1g) dipped 8.4% at rank 4, signaling selective pressure within Concentrates even as the segment gains share. The pattern implies Pop's Weed is consolidating around high-velocity Concentrates while using a few Flower SKUs to buffer volatility, pointing to a mix geared toward extraction-led growth rather than broad Flower expansion.
Top Selling Cannabis Brands






Data for this report comes from real-time sales reporting by participating cannabis retailers via their point-of-sale systems, which are linked up with Headset’s business intelligence software. Headset’s data is very reliable, as it comes digitally direct from our partner retailers. However, the potential does exist for misreporting in the instance of duplicates, incorrectly classified products, inaccurate entry of products into point-of-sale systems, or even simple human error at the point of purchase. Thus, there is a slight margin of error to consider. Brands listed on this page are ranked in the top twenty within the market and product category by total retail sales volume.

