

Sep-2026
Sales
Trend
6-Month
Product Count
SKUs
Avg Price
YoY Sales Change
YoY Price Change


Is this your brand?
See your full sales and distribution data: where you sell, how you're priced, and how you rank against the brands next to you on the shelf.
See your brand's dataCarry this brand in your store?
Headset Retailer is free. Connect your POS and see what's selling and what's sitting.
Sign up freeWhere to Buy
Potters is stocked at 88 licensed dispensaries across California, with the deepest coverage in Los Angeles, San Diego, Sacramento, Vista, and Chula Vista. Search by ZIP code or city below to find the closest one, or filter by product type if you are after a specific format.
Market Insights Snapshot
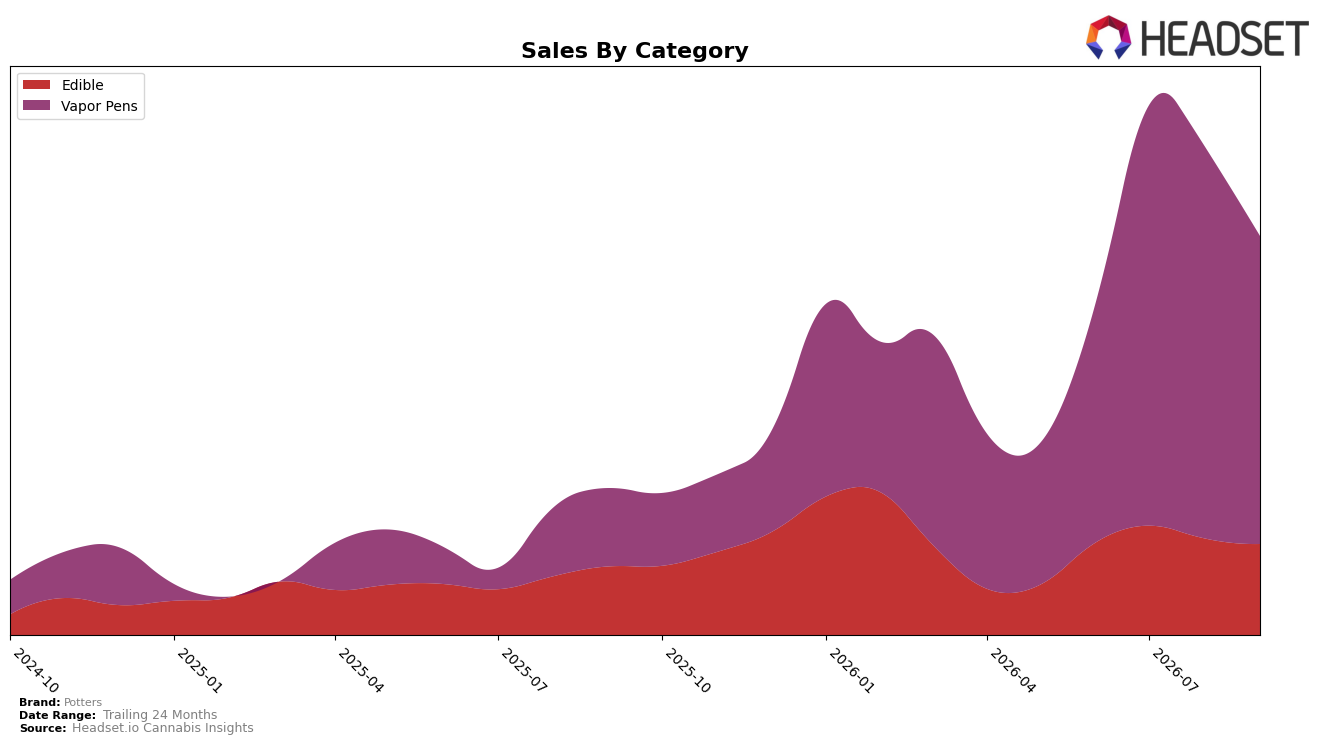
Vapor Pens drove 76.61% share in September 2026, with year-over-year sales up 279.29% but month-over-month down 21.26%, while Edible held 23.39% share with a 30.89% YoY increase and a 5.53% MoM decline; against this mix, Potters’ overall brand sales rose 162.69% YoY and average price rose 17.07%. Within California Vapor Pens, Potters ranked 90th, and the category’s average price of $25.26 versus Edible at $16.38 indicates a deliberate tilt toward higher-ticket formats; the pattern implies Potters is concentrating volume in Vapor Pens despite short-term MoM contraction, using price and mix to compound YoY gains.
The combination of a 21.26% MoM pullback in Vapor Pens and a 5.53% MoM dip in Edible, alongside a 279.29% YoY surge in Vapor Pens and 30.89% YoY growth in Edible, suggests Potters is absorbing near-term volatility to anchor its positioning in a premium-leaning pen portfolio; the $25.26 pen price relative to the brand’s $22.42 average points to up-tier assortment pressure. Holding 76.61% of sales in Vapor Pens while ranking 90th in the California category implies headroom: the mix can elevate rank if Potters sustains pen share while stabilizing monthly cadence, meaning the strategy is to trade depth in a single category for future laddering within that category.
Competitive Landscape
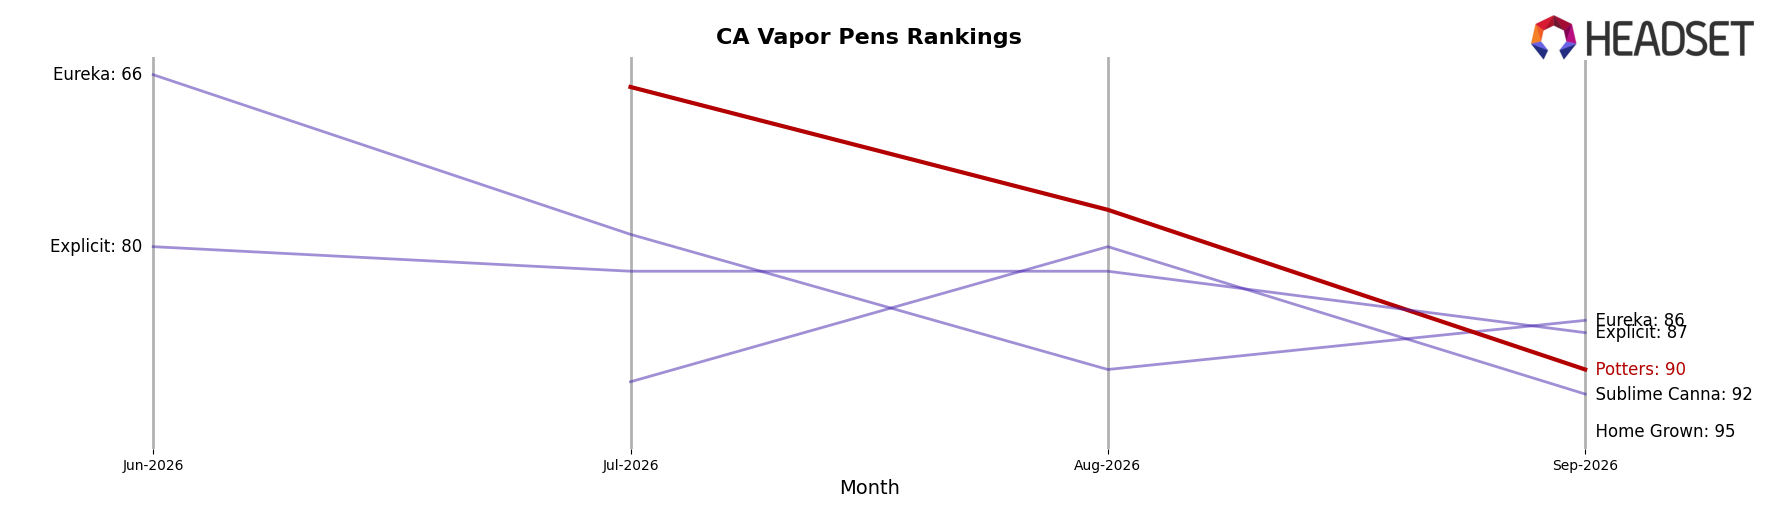
Potters ranks #90 in California Vapor Pens in September 2026, improving 55 positions YoY from #145, and rising 14 ranks since June 2026 when it sat at #104; the brand’s peak at #67 in July 2026 marks a 23-place slide from peak to September while still netting a 55-place YoY climb. Against category leaders, STIIIZY held #1 with a -16.7% YoY sales change while Potters rose in rank, and Jetty Extracts advanced from #4 to #3 with +45.2% YoY sales growth, indicating that Potters’ mid-summer peak and subsequent two-month drift coincide with leaders consolidating top slots as fast growers press upward. The pattern implies Potters is transitioning from recovery to stabilization: the YoY surge in rank sets a higher floor, but the drop from #67 in July 2026 to #90 in September 2026 signals that sustaining share will require countering both entrenched #1 incumbency and momentum brands expanding share velocity.
Notable Products
Blue Razz Live Resin Disposable (1.25g) posted the standout move in September 2026 with an 80.2% month-over-month gain to rank 1, while Raspberry Runtz Live Resin Cartridge (1g) fell 41.4% and slid to rank 5, indicating volatility within the same Vapor Pens lane. Vapor Pens occupy seven of the top ten ranks in September 2026, and within that concentration Melonade Live Resin Cartridge (1g) sits at rank 2 alongside Northern Lights Live Resin Disposable (1.25g) at rank 3, whereas the top Edible, THC/CBG 1:1 Mango Sugar Free Fruit Chews 10-Pack (100mg THC, 100mg CBG), holds rank 4 with category peers clustered at ranks 6 and 8. Peach Sugar Free Live Fruit Chews 10-Pack (100mg) rose 26.7% to rank 8 as Dragon Fruit Sugar Free Live Fruit Chews 10-Pack (100mg) declined 18.8% to rank 6, and Gone Bananas Live Terpene Disposable (1.25g) inched up 1.6% to rank 9 with $6,623 in sales. The mix points to a Vapor Pens-led strategy with selective Edible support, signaling that Potters is prioritizing high-velocity pen SKUs while using a few sugar-free Edibles to hedge category swings.
Top Selling Cannabis Brands






Data for this report comes from real-time sales reporting by participating cannabis retailers via their point-of-sale systems, which are linked up with Headset’s business intelligence software. Headset’s data is very reliable, as it comes digitally direct from our partner retailers. However, the potential does exist for misreporting in the instance of duplicates, incorrectly classified products, inaccurate entry of products into point-of-sale systems, or even simple human error at the point of purchase. Thus, there is a slight margin of error to consider. Brands listed on this page are ranked in the top twenty within the market and product category by total retail sales volume.

