.svg)
Aug-2026
Sales
Trend
6-Month
Product Count
SKUs
Avg Price
YoY Sales Change
YoY Price Change


Market Insights Snapshot
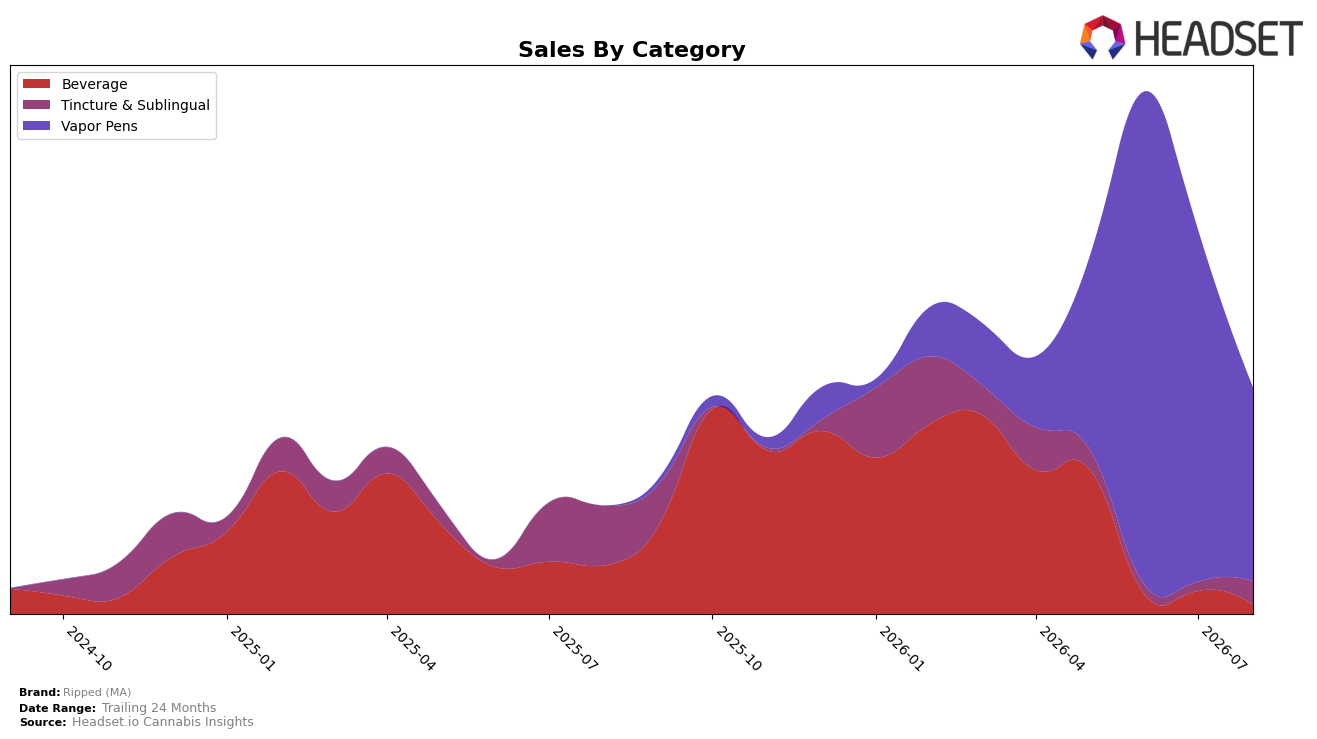
Ripped (MA) concentrated 85.74% of August 2026 sales in Vapor Pens, but that anchor category fell 45.11% month over month while lacking a reported year-over-year figure, and Beverage slid to 3.67% share with a 63.37% MoM decline and an 82.82% YoY drop; the outlier was Tincture & Sublingual, which expanded to 10.59% share on a 170.21% MoM surge despite a 59.69% YoY contraction. At the brand level, sales were up 110.02% YoY alongside a 60.12% YoY decline in average price, indicating the mix shift toward lower-priced formats like Beverage (average price $5.90) and Tincture & Sublingual (average price $9.27) while Vapor Pens carried a higher ticket at $12.39; the pattern implies volume throughput is compensating for price compression as category reliance becomes less stable.
The combination of a shrinking Vapor Pens base (-45.11% MoM) and accelerating Tincture & Sublingual (+170.21% MoM) positions Ripped (MA) to lean into price-accessible entries while Beverage weakness (-63.37% MoM and -82.82% YoY) limits cross-format halo. Given that Massachusetts Beverage rank data is unavailable and Beverage share is only 3.67%, the near-term posture skews toward defending pen penetration while cultivating a secondary pillar in Tincture & Sublingual (10.59% share), which, paired with a 60.12% YoY average price drop, implies a deliberate pivot to value-led pack sizes to stabilize revenue despite category volatility.
Competitive Landscape
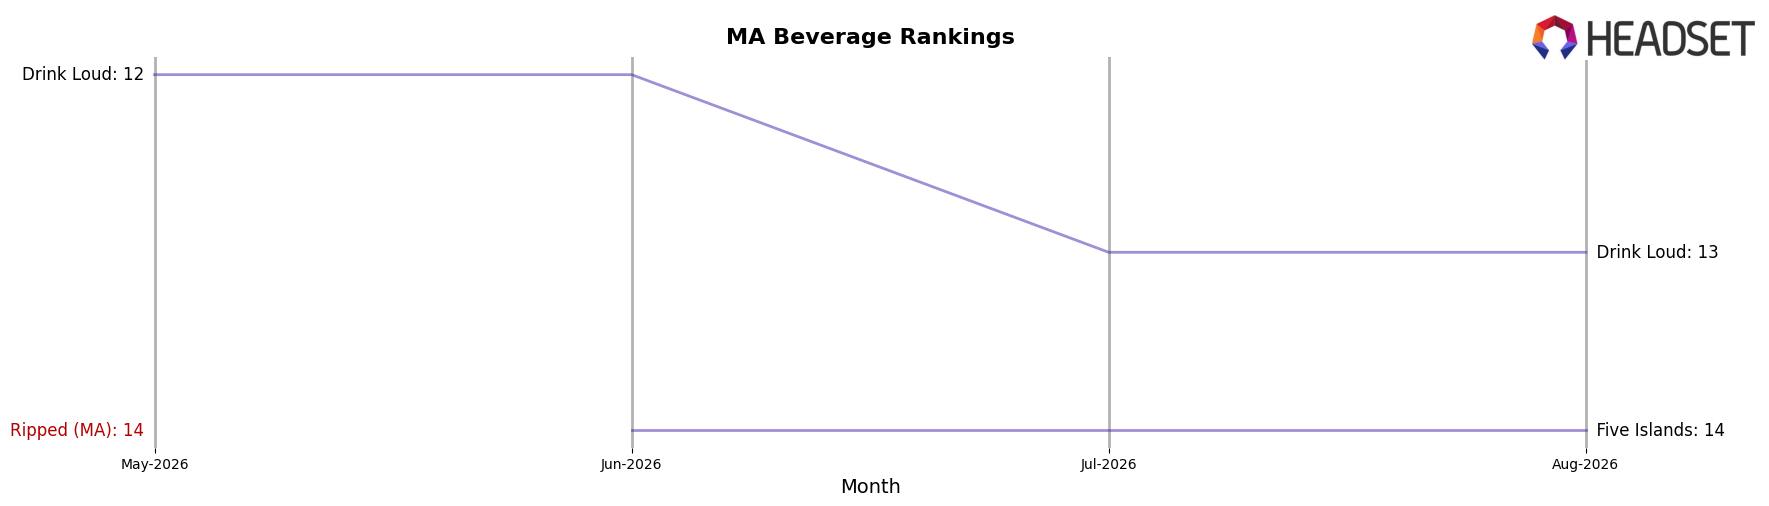
Ripped (MA) sits at #17 in MA Beverage in August 2026, down 1 rank from #16 year over year and 3 positions below its 3‑month mark of #14, while still 5 spots off its March 2026 peak at #12; meanwhile, Levia held #1 both this year and last with sales up 6.0% year over year, and Pine + Star improved from #5 to #4 with a 4.9% sales lift, indicating Ripped (MA) lost relative momentum as rivals either maintained leadership or edged upward, implying the brand’s rank trajectory points to share pressure unless it reclaims gains seen earlier in March 2026.
Notable Products
Fire Diesel Distillate Cartridge (1g) delivered the headline move with a 133.9% month-over-month surge to rank 1, while Lilac Diesel Distillate Cartridge (1g) climbed 59.9% to rank 2, indicating upside consolidation at the very top. In contrast, Glue Distillate Cartridge (1g) slipped 13.3% at rank 4 and Blue Dream Distillate Cartridge (1g) fell 79.1% at rank 9, with Maui Paradise Distillate Cartridge (1g) dropping 95.3% at rank 10; five of the top ten are Vapor Pens, signaling concentration risk alongside leadership upside. Watermelon Syrup Tincture (500mg) entered at rank 3 with no prior month comparison and Strawberry Syrup (500mg THC, 16oz, 473ml) declined 63.4% at rank 7, suggesting non-vape formats are volatile and secondary to vape momentum. The pattern implies Ripped (MA) is leaning into a winner-take-most Vapor Pens strategy where a few fast-rising SKUs can offset broad declines but increase dependency on top performers.
Top Selling Cannabis Brands






Data for this report comes from real-time sales reporting by participating cannabis retailers via their point-of-sale systems, which are linked up with Headset’s business intelligence software. Headset’s data is very reliable, as it comes digitally direct from our partner retailers. However, the potential does exist for misreporting in the instance of duplicates, incorrectly classified products, inaccurate entry of products into point-of-sale systems, or even simple human error at the point of purchase. Thus, there is a slight margin of error to consider. Brands listed on this page are ranked in the top twenty within the market and product category by total retail sales volume.

