.svg)
Jul-2026
Sales
Trend
6-Month
Product Count
SKUs
Avg Price
YoY Sales Change
YoY Price Change


Where to Buy
Space Poppers is stocked at 125 licensed dispensaries across Massachusetts and New York, 71 of them in Massachusetts, with the deepest coverage in Boston, Northampton, Worcester, Brockton, and Cambridge. Search by ZIP code or city below to find the closest one.
Market Insights Snapshot
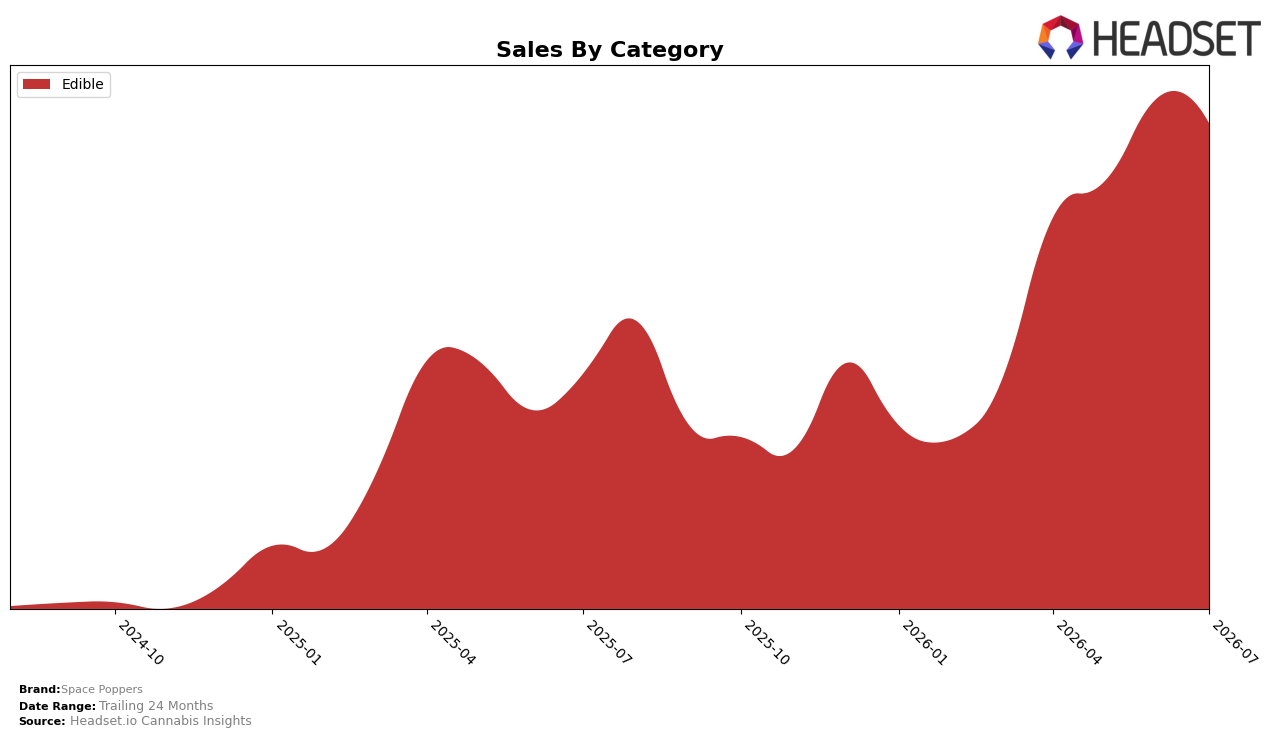
In July 2026, Space Poppers was concentrated entirely in Edible, with category share at 100.0% and a rank of 49 in Massachusetts Edible, while average price rose 21.13% year over year and sales climbed 100.60% year over year. Month over month, sales in Edible fell 4.84% alongside unchanged category concentration at 100.0%, and the average price at $23.00 suggests mix stability even as the rank position at 49 trails higher-tier placements. The pattern implies Space Poppers is scaling within a single-category focus that doubles sales year over year but gives up some month-over-month momentum, which limits upward rank mobility in Massachusetts.
The all-in Edible mix at 100.0% combined with a 21.13% average price increase and a 100.60% sales jump indicates price-led expansion rather than diversification, while the 4.84% month-over-month decline points to sensitivity when price holds. Holding rank at 49 within Edible suggests that July 2026 gains are not translating into relative share capture, and the single-category exposure leaves Space Poppers vulnerable to Edible-specific seasonality and promotional cycles. The implication is that sustaining July 2026 velocity will likely require either broadening beyond Edible to dilute volatility or refining price-pack architecture within Edible to convert year-over-year growth into rank improvement.
Competitive Landscape
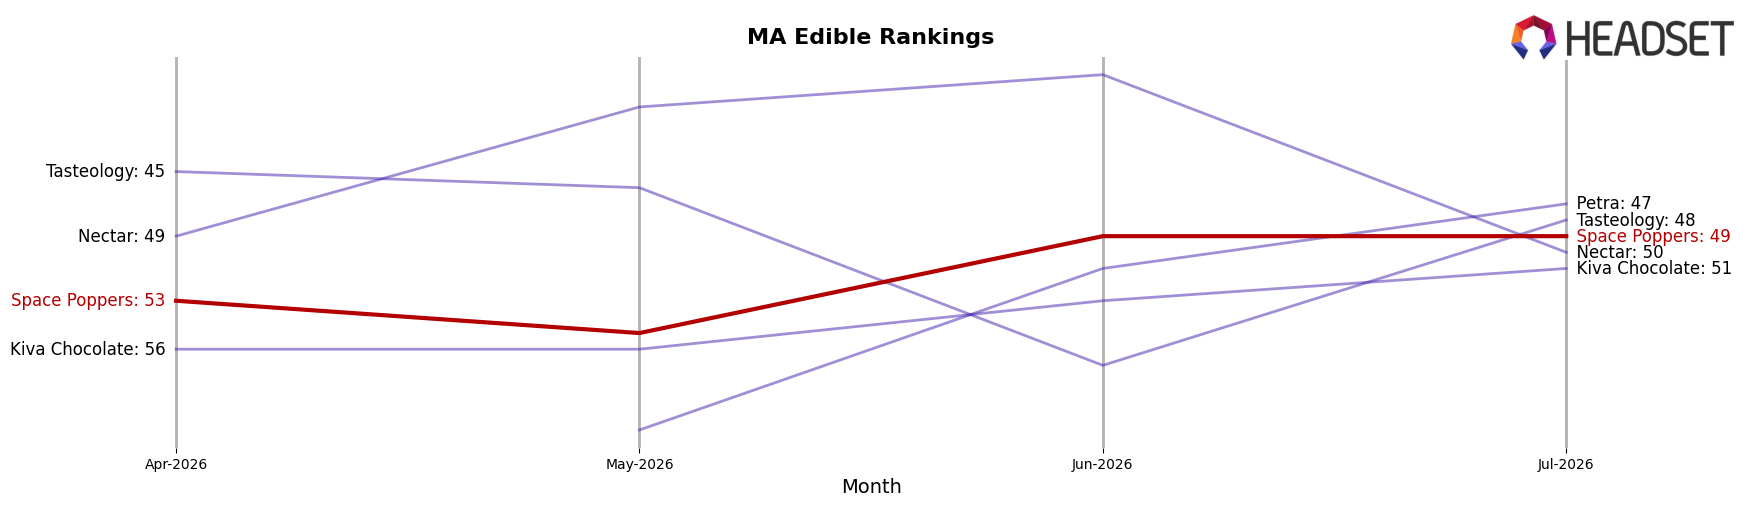
Space Poppers sits at rank #49 in Massachusetts Edible for July 2026, improving 1 position year over year from #50 and rising 4 spots versus April 2026’s #53, while still trailing its peak #48 from August 2025 by 1 place; meanwhile, Camino moved up from #2 to #1 and Wyld advanced from #5 to #3 as of July 2026, indicating category leaders are gaining rank faster than Space Poppers’ incremental climb. The pattern implies Space Poppers is edging upward but not closing the competitive gap, as modest rank gains of 2% to 8% relative movement sit against top competitors’ rank ascents of 1 to 2 positions that consolidate share at the top.
Notable Products
CBD/THC 1:1 Churros Popcorn 25-Pack (25mg CBD, 25mg THC) posted the sharpest movement in July 2026 with +67.9% MoM and a climb to rank 3, while CBD/THC 1:1 Chicago Style Popcorn 50-Pack (100mg CBD, 100mg THC) followed at +49.1% MoM and rank 2. In contrast, CBD/THC 1:1 Sea Salt Caramel Popcorn 50-Pack (100mg CBD, 100mg THC) fell -27.1% MoM yet retained rank 1, and the non-infused Sea Salt Caramel Popcorn 50-Pack (100mg) dropped -46.8% MoM at rank 5. With all top-6 SKUs in Edible and three 1:1 formulations occupying ranks 1-4, the mix signals a pivot toward higher-THC/CBD parity formats winning share at the expense of legacy single-compound popcorns.
Top Selling Cannabis Brands






Data for this report comes from real-time sales reporting by participating cannabis retailers via their point-of-sale systems, which are linked up with Headset’s business intelligence software. Headset’s data is very reliable, as it comes digitally direct from our partner retailers. However, the potential does exist for misreporting in the instance of duplicates, incorrectly classified products, inaccurate entry of products into point-of-sale systems, or even simple human error at the point of purchase. Thus, there is a slight margin of error to consider. Brands listed on this page are ranked in the top twenty within the market and product category by total retail sales volume.

