.svg)


Where to Buy
Minny Grown is stocked at 145 licensed dispensaries across Minnesota, New York, and 3 other states, 55 of them in Minnesota, with the deepest coverage in Minneapolis, Saint Paul, Duluth, Edina, and Fridley. Search by ZIP code or city below to find the closest one, or filter by product type if you are after a specific format.
Market Insights Snapshot
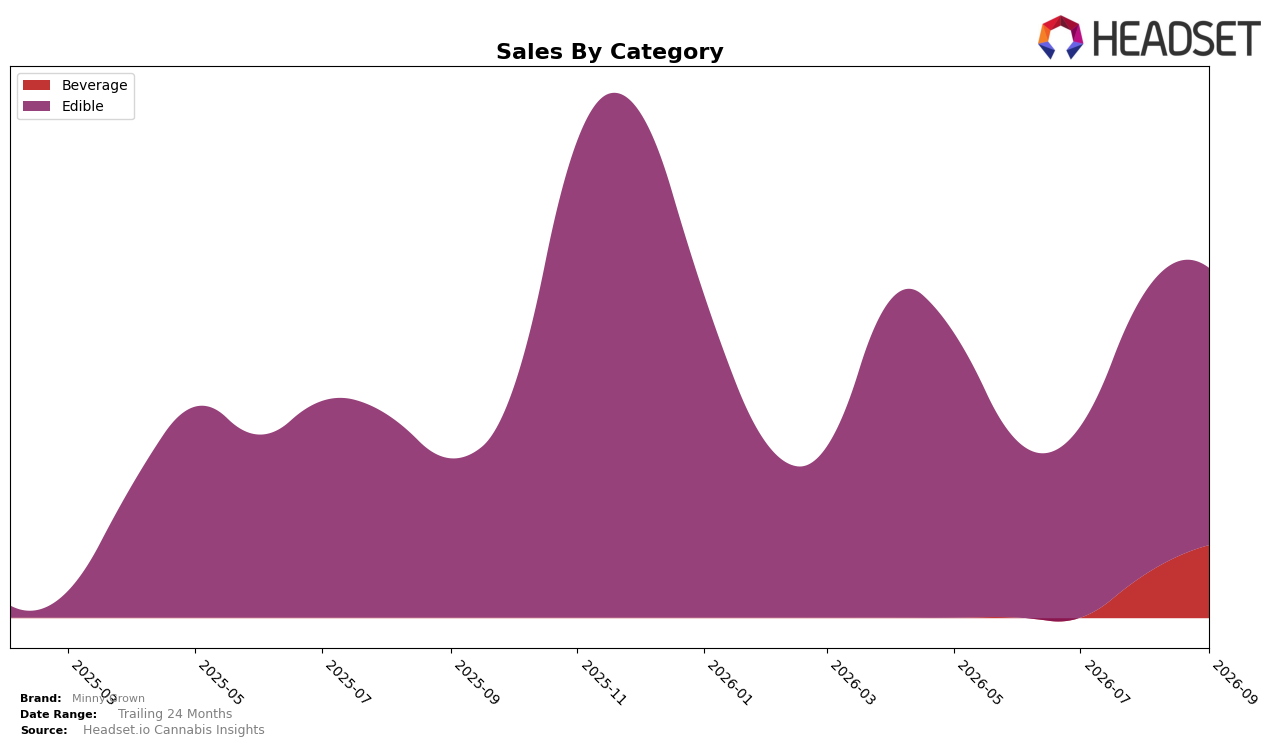
Minny Grown concentrated 79.18% of September 2026 sales in Edible, with Beverage accounting for the remaining 20.82%, indicating a two-category portfolio skew. Edible sales grew 73.98% year over year but slipped 1.88% month over month, while Beverage lacked a year-over-year baseline yet surged 68.26% month over month, implying a rapid near-term uptake from a smaller base. The brand posted 119.71% year-over-year sales growth overall alongside a 42.40% year-over-year drop in average price, and within Edible the average price sat at $19.60, signaling volume-led gains at lower ticket sizes. Positioned 67th in Edible in New York, Minny Grown’s current mix and pricing cadence imply a deliberate push to scale units in Edible while seeding Beverage for incremental share capture.
The shift—Edible down 1.88% month over month while Beverage rose 68.26% month over month—suggests Minny Grown is using price elasticity (average price down 42.40% year over year) to defend its Edible base while activating trial in Beverage to diversify risk. With 79.18% of sales still tied to Edible and a 73.98% year-over-year gain there, the 20.82% Beverage share provides a buffer that can lift rank from 67 in New York Edibles if cross-category penetration converts to repeat. The pattern implies near-term positioning as a value-accessible Edible player using Beverage momentum to expand basket size and stabilize month-over-month variability as unit-led growth outpaces pricing power.
Competitive Landscape
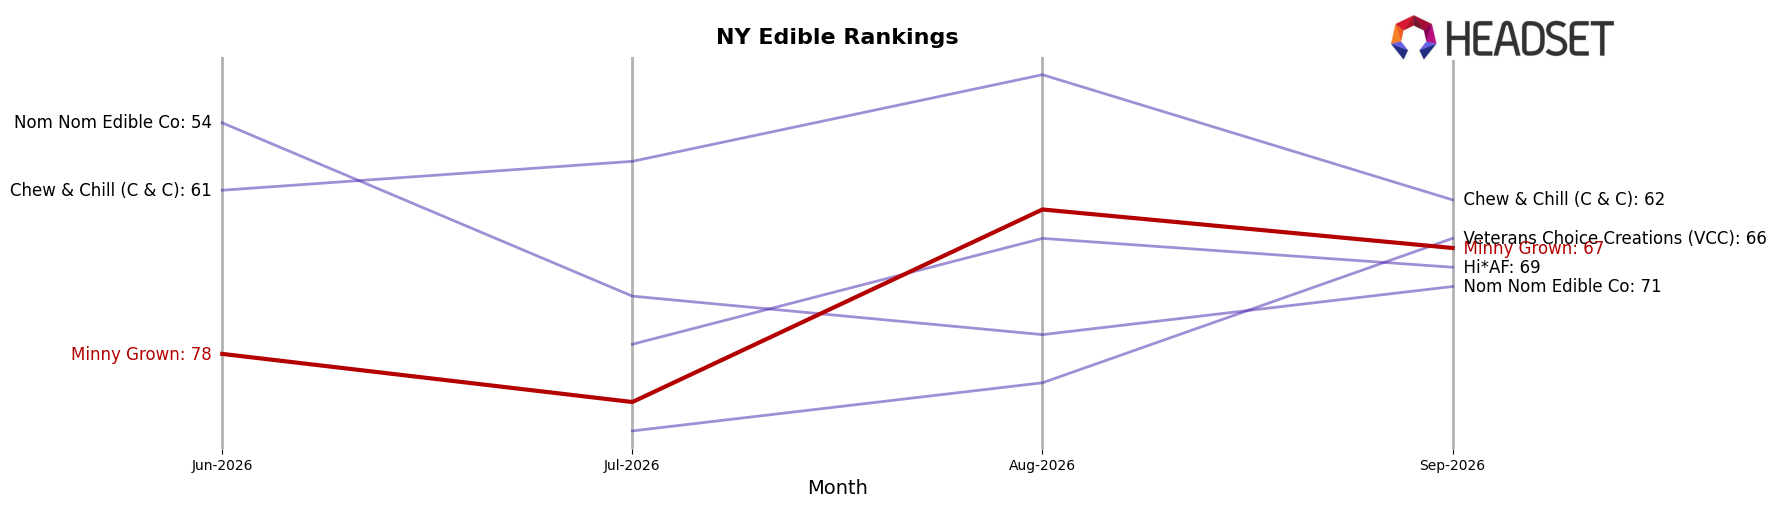
Minny Grown is ranked #67 in NY Edible in September 2026, down 4 places year over year from #63 and up 11 places from #78 in June 2026, while its peak of #43 in November 2025 marks a 24-rank slide from that high; by contrast, Wyld moved up from #3 to #2 with a 13.98% YoY sales increase and Off Hours fell from #1 to #3 with a -28.14% YoY sales decline, indicating that Minny Grown’s recent quarter-on-quarter climb coexists with a longer-term erosion in competitive standing that implies stabilization rather than a return to prior peak without a change in velocity.
Notable Products
Boat Cruise Cosmo (10mg THC, 12oz, 355ml) posted the headline move in September 2026 with +108% MoM to rank 1, while Lady Liberty Cherry Cheesecake Gummies 10-Pack (100mg) fell -58% MoM to rank 10, indicating a sharp pivot from legacy edibles toward ready-to-drink velocity. Ohhh My... Minnarita (10mg THC, 12oz, 355ml) climbed +99% MoM to rank 2, and four of the top ten are Beverage SKUs occupying ranks 1–4, suggesting the category is concentrating share at the top even as CBC/CBG/THC 1:1:2 Cascade Clementine Gummies 10-Pack (50mg CBC, 50mg CBG, 100mg THC) slipped -24% MoM at rank 7. Despite THCV/THC 1:2 Mythical Manhattan Mango Gummies 10-Pack (50mg THCV, 100mg THC) holding rank 5 on +6% MoM and $3,140 in sales, the month’s mix tilts toward beverages for near-term shelf priority and promotional focus.
Top Selling Cannabis Brands






Data for this report comes from real-time sales reporting by participating cannabis retailers via their point-of-sale systems, which are linked up with Headset’s business intelligence software. Headset’s data is very reliable, as it comes digitally direct from our partner retailers. However, the potential does exist for misreporting in the instance of duplicates, incorrectly classified products, inaccurate entry of products into point-of-sale systems, or even simple human error at the point of purchase. Thus, there is a slight margin of error to consider. Brands listed on this page are ranked in the top twenty within the market and product category by total retail sales volume.

